Customer Service Metrics That Actually Matter in 2026 (and the Vanity Ones to Drop)
Most e-commerce support teams track deflection rate and ticket volume — both vanity metrics. The 8 metrics that drive real outcomes are resolution rate, FCR, CSAT, CES, cost-per-resolution, AHT, repeat contact rate, and escalation rate. Full breakdown with 2026 benchmarks.
Customer Service Metrics That Actually Matter in 2026 (and the Vanity Ones to Drop)
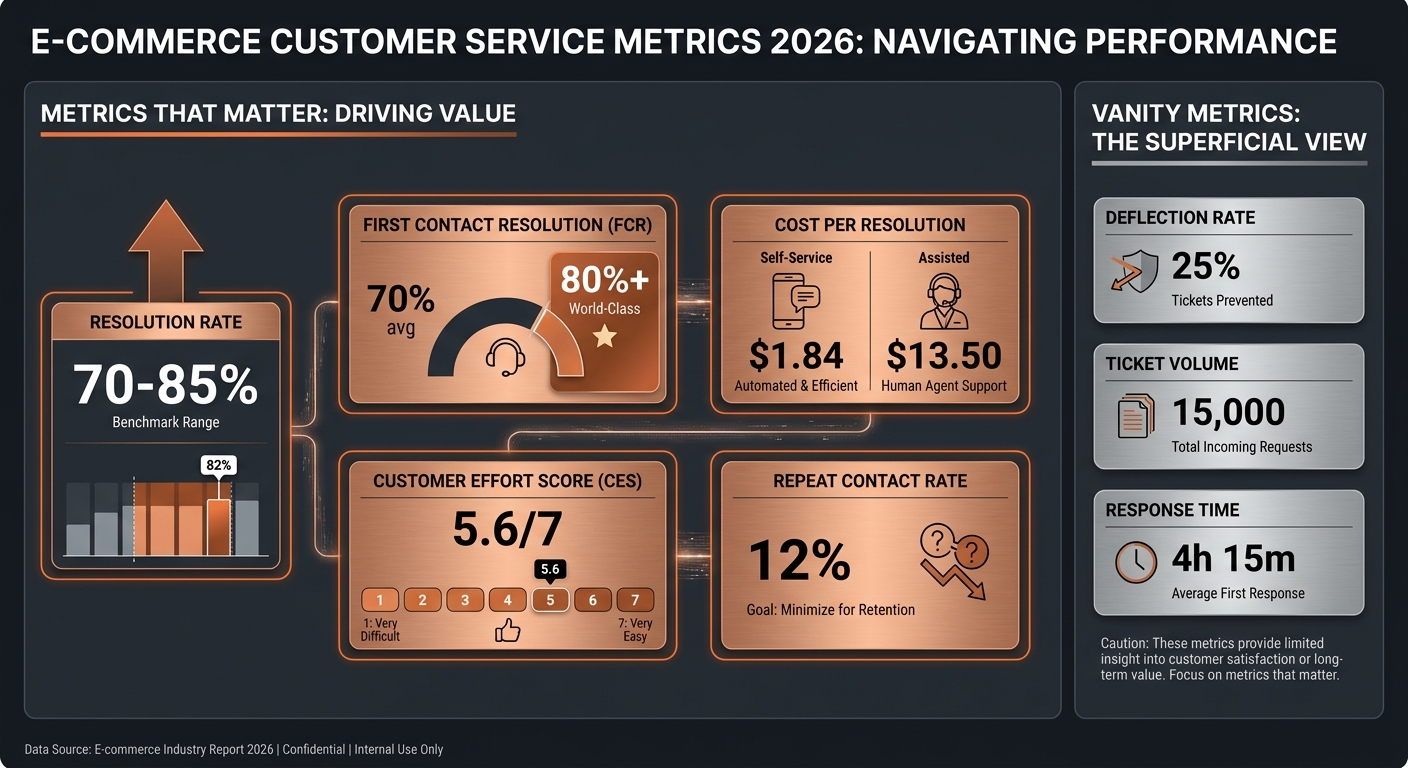
Eight customer service metrics drive real e-commerce outcomes in 2026: resolution rate, First Contact Resolution (FCR), CSAT, Customer Effort Score (CES), cost-per-resolution, Average Handle Time (AHT), repeat contact rate, and escalation rate. Deflection rate and total ticket volume — the two most-tracked metrics in most CX dashboards — are vanity metrics that measure activity, not results. Here is the full breakdown with current benchmarks.
TL;DR: The 8 Metrics That Matter vs. The Ones to Drop
| Metric | Benchmark | What It Measures | Keep or Drop? |
|---|---|---|---|
| Resolution rate | 70–85% (AI agents) | Tickets genuinely resolved without escalation | Keep |
| First Contact Resolution (FCR) | 70% avg / 80%+ world-class | Issues resolved in one interaction | Keep |
| CSAT | 75–84% good / 85%+ world-class | Customer satisfaction post-interaction | Keep |
| Customer Effort Score (CES) | Lower is better | How hard it was for the customer | Keep |
| Cost per resolution | $1.84 (self-service) / $13.50 (assisted) | True per-outcome support cost | Keep |
| Average Handle Time (AHT) | Context-dependent | Time per ticket | Keep (in context) |
| Repeat contact rate | Below 10% world-class | Same-issue re-contacts in 7–30 days | Keep |
| Escalation rate | Track by ticket type | % of tickets reaching a human | Keep |
| Deflection rate | — | Contacts the system avoided | Drop |
| Total ticket volume | — | Raw inbound count | Drop (as a KPI) |
What Makes a Customer Service Metric "Vanity" vs. "Actionable"?
A vanity metric is one that can go up while customer outcomes get worse. Deflection rate is the clearest example: your deflection rate can increase if you add more friction to your contact form, make your chatbot more aggressive about ending conversations, or reduce operating hours. None of those changes improve customer outcomes — but every one of them drives deflection rate up.
An actionable metric is one that can only improve if customer outcomes improve. Resolution rate is the inverse of deflection rate in exactly this sense: it only increases if a customer's problem was actually solved. You cannot fake a high resolution rate with friction.
The test for any metric you're tracking: can it go up without customers being better off? If yes, it belongs in the "vanity" column.
What Is the Most Important Customer Service Metric in 2026?
Resolution rate — the percentage of tickets resolved end-to-end without human escalation or a repeat contact — is the single metric that most accurately captures whether your support operation is delivering value. It synthesizes the information from FCR, cost-per-resolution, and escalation rate into one number.
Resolution rate is where the difference between AI agents and chatbots is most visible in practice. AI agents that can access systems (Shopify orders, carrier tracking, refund APIs), apply your SOPs, and take action resolve 70–85% of tier-1 e-commerce tickets. Rule-based chatbots and deflection tools resolve 30–40%. The 30–40-point gap between those two ranges is the gap in resolution rate — and it drives every downstream metric: FCR, cost-per-resolution, repeat contact rate, CSAT, and escalation rate all improve when resolution rate moves up.
Per Gartner (Senior Director Analyst Daniel O'Sullivan, March 2025): "By 2029, agentic AI will autonomously resolve 80% of common customer service issues without human intervention, leading to a 30% reduction in operational costs." The trajectory of the category is toward higher resolution rates, not higher deflection rates. CX leaders who optimize for resolution now are building toward that model; those who optimize for deflection are optimizing for a metric that will look increasingly hollow as autonomous resolution becomes the baseline.
Why Is Deflection Rate a Vanity Metric?
Deflection rate measures how many contacts your system handled without passing to a human agent. The measurement stops there — it does not ask whether the customer's issue was resolved.
The failure mode is well-documented: a chatbot that responds to every "where is my order?" with "your order is processing" and closes the conversation has a 100% deflection rate and a 0% resolution rate on those cases. Those customers come back — often through email or phone, at $8–$13 per escalated contact — or they churn silently. The true cost of that behavior is invisible in the deflection metric.
A 23% repeat-contact rate means that for every 100 unique issues, 123 tickets are opened. If your deflection tool is closing conversations without resolving them, your repeat-contact multiplier is inflating your true cost-per-resolution while your deflection rate looks healthy. The two metrics are pointing in opposite directions and the deflection rate is lying.
Replace deflection rate with resolution rate as your primary containment metric. They are not the same thing, and tracking the wrong one produces the wrong behavior: your team will optimize for keeping customers out of the queue rather than resolving what brings them there.
What Is a Good First Contact Resolution (FCR) Rate?
FCR measures the percentage of customer issues resolved in a single interaction, without requiring a follow-up contact.
The benchmarks: Per SQM Group's contact center research, the all-industry FCR average is 70%. World-class performance — 80%+ — is achieved by roughly 5% of contact centers. For e-commerce specifically, FCR ranges vary by ticket type:
| Ticket Type | Typical FCR Range |
|---|---|
| WISMO (order status) — automated | 85–95% |
| Refund request — automated with guardrails | 60–75% |
| Address change or order modification | 70–85% |
| Damaged item or carrier dispute | 45–65% |
| Complex subscription or account issue | 50–70% |
FCR is the metric that most directly drives CSAT. Per SQM Group's longitudinal research, achieving FCR is the single strongest predictor of a positive CSAT score — more so than speed, channel, or agent friendliness. A customer whose issue is resolved in one contact is dramatically more likely to report satisfaction than a customer who contacts three times and eventually reaches a resolution.
FCR improvement starts with identifying the ticket types where it's lowest. For most Shopify support queues, WISMO and order-status tickets are both the highest volume and the most automatable — making them the first target for FCR intervention.
What Is a Good CSAT Score in E-commerce?
CSAT (Customer Satisfaction Score) measures satisfaction post-interaction, typically via a simple rating prompt ("How satisfied were you with this interaction?") scored on a percentage or 1–5 scale.
The benchmarks: Per SQM Group, a good CSAT score is 75%–84%; world-class is 85%+, achieved by roughly 5% of contact centers. SQM Group's research also found that CSAT varies just 0.2 points across verticals — meaning industry doesn't explain CSAT performance. Operational quality does.
CSAT is a useful signal but has two known limitations as a standalone metric:
- Response bias. Customers with strong opinions (very satisfied or very frustrated) respond at higher rates than moderate customers. CSAT surveys consistently over-represent both extremes.
- Interaction-level vs. issue-level measurement. A customer who received a warm, apologetic response from a human agent but whose issue was not resolved may rate the interaction highly while still being at churn risk. CSAT measures the interaction experience; it doesn't always track the resolution outcome.
Use CSAT alongside Customer Effort Score and repeat contact rate rather than as your sole satisfaction signal.
What Is Customer Effort Score (CES) and Why Does It Predict Churn?
Customer Effort Score measures how much effort a customer had to exert to get their issue resolved. The standard measurement: "How easy was it to resolve your issue today?" on a 1–7 or 1–5 scale, with lower effort = higher score.
CES is the stronger churn predictor of the two standard satisfaction metrics. Gartner's foundational research on CES found that high-effort interactions are 4x more likely to create a disloyal customer than low-effort ones. The mechanism: customers do not primarily leave because of a bad product experience — they leave when getting help requires too much work.
For e-commerce, high-effort experiences typically involve:
- Multi-step authentication before reaching a resolution
- Being asked for information the agent should already have (order number, address, items ordered)
- Transferring between channels (chatbot → email → phone)
- Repeating the same information in each transfer
The cross-platform resolution model that CorePiper's SOP-driven agents implement directly attacks CES: the agent carries full context from Shopify order data, prior ticket history, and helpdesk records into every interaction — so the customer is never asked for information the system already holds. That single design principle reduces the effort metric more reliably than any post-interaction apology workflow.
Why Does AHT Mislead E-commerce Support Teams?
Average Handle Time (AHT) measures the average time spent per ticket including resolution time and wrap-up. It is a useful operational input but a dangerous primary KPI.
The failure mode: teams that optimize for AHT reduction produce agents who close tickets faster — not agents who resolve them better. A 3-minute interaction that deflects rather than resolves generates a repeat contact at 15 minutes. Your AHT is 3 minutes; your true cost-per-resolution is 18 minutes of agent time plus the re-contact overhead.
Where AHT is useful:
- As a diagnostic for specific ticket types. If WISMO tickets are averaging 8 minutes, that signals a tooling problem — agents are spending time on lookups that should be automated. If damage-claim tickets average 25 minutes, that's expected for a complex case requiring carrier portal access.
- As a capacity input. AHT × ticket volume = staffing hours required. That calculation is legitimate. Using AHT as a quality signal is not.
Track AHT by ticket type and trend it alongside FCR for the same ticket type. A drop in AHT with a simultaneous drop in FCR on the same ticket type is a signal that agents are closing tickets faster by not fully resolving them — a red flag that AHT optimization is coming at the expense of outcome quality.
How Does Cost-Per-Resolution Expose Your True Support Model?
Cost-per-resolution is the fully loaded cost of taking one customer issue from open to resolved — including agent time, tooling overhead, management cost, and the repeat-contact multiplier for issues that required more than one contact.
The benchmarks from Gartner ("Benchmarks to Assess Your Customer Service Costs"): the median cost per contact is $1.84 for self-service and $13.50 for assisted channels (phone, chat, email). That 7.3x gap is the fundamental cost dynamic in e-commerce support.
Where most published ticket costs ($2.70–$5.60) undercount: they measure direct labor in steady state and exclude agent turnover, onboarding, and the repeat-contact multiplier. Once those are added, the true cost per resolution for a mid-size e-commerce team regularly exceeds $8–$10 per unique issue resolved.
Cost-per-resolution is the metric that makes AI support investment decisions tractable. If your current true cost-per-resolution is $9 per issue and an AI agent running at $2.50 per resolved case can resolve 70% of your volume end-to-end, the math is straightforward: the 70% that shifts to AI runs at $2.50; the 30% that remains with humans runs at $9. Your blended cost-per-resolution drops by 44% — and that doesn't account for the FCR improvement from AI resolution (which reduces repeat contacts) or the staffing flexibility from reduced human queue volume.
What Is Repeat Contact Rate and Why Does It Matter More Than Ticket Volume?
Repeat contact rate measures the percentage of customers who contact support again about the same issue within a defined window — typically 7 or 30 days.
Why it matters more than total ticket volume: Ticket volume is a function of customer base size, marketing activity, and seasonal patterns. It is a business input, not a support quality signal. Repeat contact rate is pure signal: it measures whether your support operation is actually closing customer problems.
E-commerce repeat contact rates typically run 20–30% for operations relying on deflection tools. World-class operations run below 10%. The difference is not speed or staffing — it's whether the first contact resolves the issue or defers it.
The repeat contact rate is also the metric that exposes the true cost difference between deflection and resolution. A 25% repeat contact rate applied to a $5 per-ticket operation means your effective cost per resolved issue is $5 × 1.25 = $6.25 — before accounting for the channel escalation that often accompanies second contacts (customers who didn't get their answer via chatbot on the first try often escalate to email or phone on the second attempt, at $8–$13 per escalated contact).
How Do You Build a Metrics Dashboard That Drives the Right Behavior?
The core principle: your dashboard should include exactly one primary metric for each decision it needs to support.
For resolution quality: Lead with resolution rate. Track FCR and repeat contact rate as the two components that explain it. Surface CSAT and CES as experience signals alongside resolution rate, not as substitutes for it.
For cost: Lead with cost-per-resolution. Track escalation rate as the primary lever (every percentage point of escalation reduction saves roughly $11 per ticket at Gartner's benchmarks). Track AHT by ticket type as a diagnostic input, not a performance score.
For team performance: Track FCR per agent and per ticket type, not AHT. Agents with higher FCR are more valuable than agents with lower AHT — even if the high-FCR agent takes longer on each ticket, their tickets come back less often.
What to remove from weekly reporting: Deflection rate (replace with resolution rate). Total ticket volume as a KPI (retain as a capacity input). Avg response time as a quality metric (replace with CES and FCR).
The behavioral consequence of this shift: your support team stops optimizing for closing tickets quickly and starts optimizing for closing issues permanently. That behavioral shift is the precondition for any meaningful AI support investment returning its promised cost reduction — because AI resolution tools that are measured on deflection will be configured to deflect, and AI tools configured to deflect produce the 30–40% resolution rates of chatbots, not the 70–85% resolution rates of SOP-driven agents.
Frequently Asked Questions
What is the most important customer service metric in 2026?
Resolution rate — the percentage of tickets genuinely resolved without human escalation or repeat contact — is the single most important metric for e-commerce support in 2026. It combines the outcomes of FCR, containment, and cost-per-resolution into one number that tracks whether your support operation is actually solving customer problems, not just processing them.
What is a good First Contact Resolution (FCR) rate for e-commerce?
Per SQM Group's benchmarks, the all-industry FCR average is 70%. World-class performance is 80%+, achieved by roughly 5% of contact centers. For e-commerce, FCR benchmarks vary by channel and ticket type: WISMO and order-status tickets have FCR rates above 85% when fully automated, while complex refund disputes may run 55–65% even with human agents.
What is a good CSAT score for e-commerce customer support?
Per SQM Group, a good CSAT score is 75%–84%; world-class is 85%+, achieved by approximately 5% of centers. CSAT is a useful leading indicator for churn risk but varies little across industries (SQM Group found CSAT varies just 0.2 points across verticals). It should be tracked alongside Customer Effort Score (CES), which is a stronger predictor of repeat contact behavior.
Why is deflection rate a vanity metric?
Deflection rate counts contacts your system avoided handling — but it doesn't distinguish between customers who found their answer and customers who gave up. A high deflection rate with a high repeat-contact rate means your system is frustrating customers into silence, not resolving their issues. Resolution rate measures the outcome deflection rate ignores: did the customer's problem actually get solved?
What is a repeat contact rate and what is a good benchmark?
Repeat contact rate measures what percentage of customers contact support again about the same issue within a defined window (typically 7–30 days). E-commerce repeat contact rates typically run 20–30%. A rate above 20% indicates your first-contact resolution is broken — either the answer was wrong, the action didn't complete, or the automation deflected without resolving. World-class operations run below 10%.
CorePiper's SOP-driven agents are built to move resolution rate, FCR, and cost-per-resolution — the metrics that translate directly to support budget impact. Cross-platform resolution across Shopify, Zendesk, Freshdesk, and Salesforce means agents carry context across every system your customers' orders touch, eliminating the repeat contacts that inflate your true cost per issue. Book a demo to see how the metrics shift when the measurement target is resolution, not deflection.
Measure Resolution, Not Deflection — Then Automate It
CorePiper's SOP-driven agents are built to move your resolution rate, FCR, and cost-per-resolution — not your deflection rate. See how cross-platform resolution across Shopify, Zendesk, Freshdesk, and Salesforce changes the metrics that actually drive your support budget. Book a 30-minute walkthrough.