The 2026 State of Freight Claims Report
Freight claims cost U.S. shippers $50B+ annually. This report benchmarks denial rates, cycle times, recovery rates, and technology adoption across LTL, FTL, parcel, and air — so ops teams know where they stand.
The 2026 State of Freight Claims Report
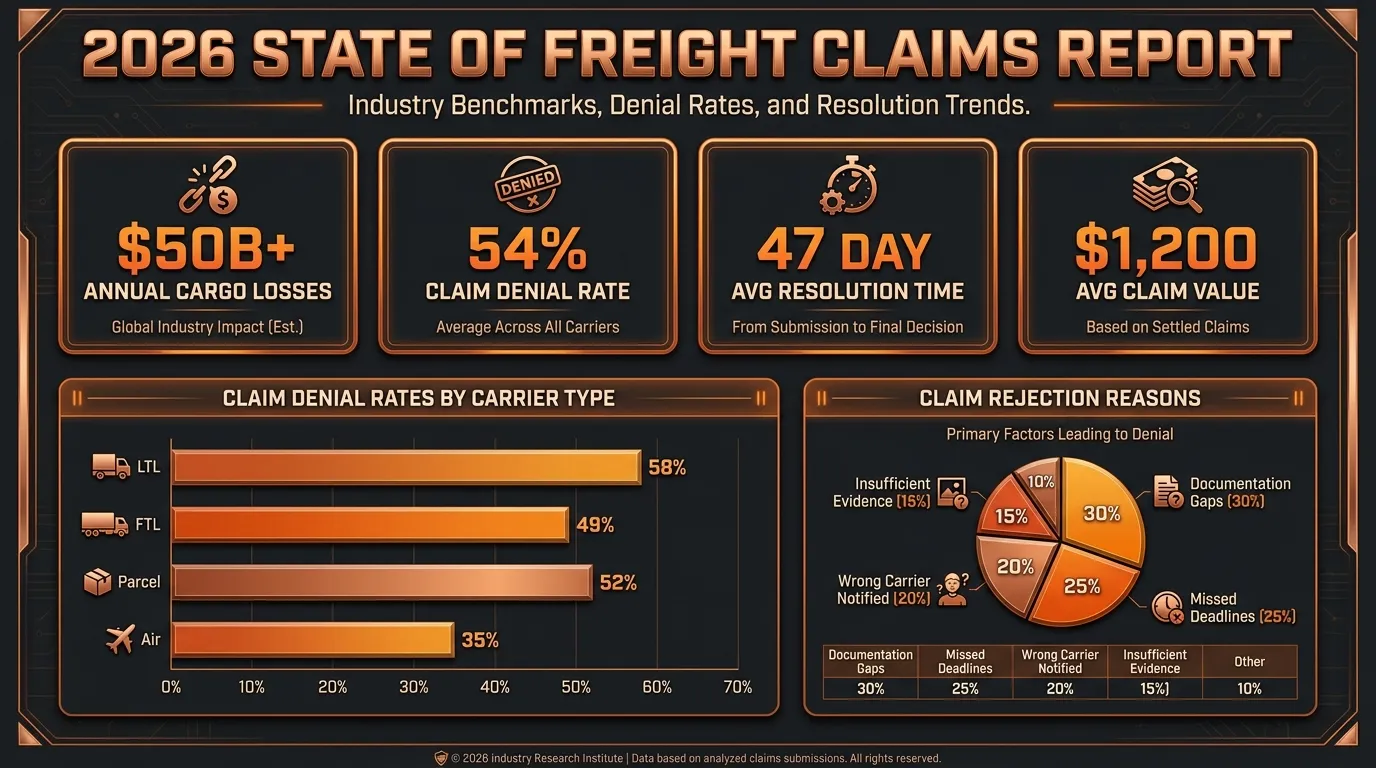
Freight claims cost U.S. shippers an estimated $50 billion or more annually — yet most operations teams are still processing them with spreadsheets, carrier portals, and institutional memory. This report benchmarks denial rates, cycle times, filing rates, recovery outcomes, and technology adoption across LTL, FTL, parcel, and air freight so ops leaders know where they stand and where the money is being left on the table.
TL;DR: Key Freight Claims Benchmarks for 2026
| Metric | Industry Baseline | Best-in-Class |
|---|---|---|
| Claim denial rate (LTL) | 50–60% | 15–25% |
| Claim denial rate (parcel) | 30–45% | 10–18% |
| Eligible claims actually filed | ~50% | 95%+ |
| Average resolution time (manual) | 47 days | 14–21 days (automated) |
| Recovery rate (manual process) | 35–45% | 70–85% |
| Average claim value (all modes) | ~$1,200 | — |
| Claims abandoned before payout | ~30% | <5% |
| Year-over-year claim volume increase | +12% (2024→2026) | — |
The gap between industry baseline and best-in-class outcomes is not a carrier problem. It's a process problem. Shippers at the top end of these benchmarks are running documented, systematic claims operations — not chasing carriers by email.
Why Are Freight Claims Increasing in 2026?
Freight claim volumes are rising faster than overall shipping volume, driven by four structural factors that have no near-term resolution.
E-commerce densification. The shift from bulk B2B freight to high-velocity parcel delivery has multiplied claim touchpoints per dollar shipped. A pallet that moved from manufacturer to retailer in one LTL shipment now arrives at ten consumer addresses through five carrier handoffs. Each handoff is a claim risk.
Carrier network strain. The post-pandemic contraction in carrier capacity — Yellow Freight's 2023 bankruptcy alone removed 10% of LTL capacity overnight — pushed volume onto networks that weren't built to absorb it. Dock congestion, driver churn, and increased transborder transfers are all correlated with higher damage rates.
Claim inflation. As freight value increases — particularly for electronics, pharmaceutical cold chain, and automotive components — the average claim value rises even when the underlying damage rate stays flat. A 15% increase in average shipment value translates directly to higher claim exposure per incident.
Documentation complexity. Carrier documentation requirements have become more stringent since 2020, not less. What carriers will accept as "sufficient proof of damage" has narrowed, creating a documentation arms race that manual processes cannot win consistently.
The compounding result: freight claim volumes among mid-market shippers (500–5,000 shipments per month) have increased approximately 12% year over year since 2024, while claims staff headcount has been flat or reduced.
What Is the Freight Claim Denial Rate in 2026?
The overall freight claim denial rate — across all modes and carrier types — sits at approximately 40–55% of filed claims. The variation by mode is significant.
LTL (Less Than Truckload) denial rates are the highest of any mode, consistently running 50–60% in surveys of mid-market shippers. The core problem is that LTL freight changes hands multiple times between pickup and delivery — each transfer point is an opportunity for documentation to break down. When a claim is filed, the carrier has clear procedural grounds to dispute causation. The bill of lading doesn't show which leg of the journey caused the damage. The proof of delivery may not include a damage notation. The concealed damage — discovered after delivery — falls into a narrow documentation window most shippers miss.
Parcel carrier denial rates (FedEx, UPS, USPS, DHL) run 30–45% for standard claims and drop to 15–20% for shippers with documented evidence submission processes. Parcel carriers have more standardized claim portals, shorter filing windows (60–180 days), and clearer documentation requirements — but they also have more aggressive first-pass denial behavior. Carriers frequently issue an initial denial on documentation grounds, banking on the shipper not appealing.
FTL (Full Truckload) denial rates are the lowest, averaging 20–35%. The simpler custody chain — one driver, one trailer, one handoff — makes causation clearer. FTL claims that are properly documented and filed within the Carmack Amendment window are rarely denied on procedural grounds; disputes tend to center on valuation rather than liability.
Air freight denial rates vary by carrier and commodity type but generally track between 25–40% for documented loss and damage claims.
The consistent pattern across all modes: denial rates for automated, documented claim submissions are roughly half the denial rates for manual submissions. The difference is not carrier goodwill — it's that automated processes eliminate the most common denial triggers.
What Are the Most Common Reasons Freight Claims Are Denied?
Understanding denial reasons is the first step toward eliminating them. Based on carrier denial notice analysis and shipper operations surveys, the seven most common denial triggers in 2026 are:
1. Incomplete or missing documentation (35–40% of denials). The most common denial trigger by a wide margin. Carriers require the original bill of lading, proof of delivery with damage notation, invoices establishing cargo value, photographs of damage in original packaging, and weight certificates for shortage claims. Missing any single document gives the carrier grounds for denial. The documentation requirement seems simple on paper; in practice, collecting all documents across three to five internal systems under time pressure is where most manual processes fail.
2. Missed filing deadline (20–25% of denials). Every carrier enforces filing windows that vary by damage type, commodity, and shipper relationship. FedEx requires concealed damage claims within 60 days of delivery. UPS allows 9 months for hidden damage. LTL carriers vary from 9 months to 2 years. Missing the deadline — even by one day — results in automatic denial under the Carmack Amendment, regardless of the claim's merit. Deadline tracking across a portfolio of 200+ open claims per month is beyond what spreadsheets reliably manage.
3. No damage notation at delivery (15–18% of denials). Carriers routinely deny visible damage claims when the proof of delivery shows a clean signature without damage notation. "Received in good condition" on the POD gives the carrier a compelling defense against a damage claim filed days later. Training delivery drivers and dock staff to note exceptions at the point of receipt, and building systematic notification processes, closes this gap — but it requires coordination across shipping, receiving, and carrier relations that most ops teams don't have.
4. Incorrect carrier or shipper liability (8–12% of denials). When freight moves through interline agreements — multiple carriers sharing a single shipment — identifying which carrier is legally liable requires tracing the custody log. Filed against the wrong carrier, the claim goes nowhere. Filed against a broker rather than the operating carrier, the same result. The Carmack Amendment establishes the delivering carrier as the responsible party for most claims, but the practical application requires knowing who actually delivered the shipment.
5. Valuation disputes (8–10% of denials). Carriers limit liability under released rates and tariff provisions. A shipper who declared a $5,000 value at booking but is seeking $15,000 in actual damages will face a denial for the gap. Properly establishing cargo value at booking — and ensuring that the bill of lading reflects replacement value, not invoice cost — prevents most valuation disputes before they start.
6. Packaging inadequacy (5–8% of denials). Carriers reserve the right to deny claims when they can demonstrate that inadequate packaging contributed to or caused the damage. This is particularly common for fragile freight — glassware, electronics, artwork — where packing standards are published in NMFC rules. A shipper using non-standard packaging for a commodity with specific packing requirements gives the carrier a defensible denial basis.
7. Untimely inspection or carrier exception notice (3–5% of denials). When a shipper discovers concealed damage, the Carmack Amendment and most carrier tariffs require written notice to the carrier within a specified window — often 15 days. Failing to notify the carrier that an inspection of concealed damage has occurred, or failing to preserve the original packaging for carrier inspection, can void the claim before it's formally filed.
The critical insight: six of these seven denial triggers are process failures, not evidence failures. The freight was damaged. The documentation exists. But the claim was lost to a missed deadline, wrong addressee, or missing notation. This is the gap that systematic claims processes close.
How Long Does the Average Freight Claim Take to Resolve?
The federal framework establishes minimum acknowledgment and resolution timelines: carriers must acknowledge claims within 30 days of filing and issue a final disposition within 120 days. In practice, the average freight claim under manual processing takes 47 days from filing to final payment or denial, with significant variance by mode and carrier.
LTL claims average 60–90 days under manual processing. The longer timeline reflects the LTL carrier investigation process: the carrier must interview dock personnel at each terminal where the freight was handled, retrieve security footage, and obtain statements from drivers. This investigation is thorough precisely because liability is ambiguous across multiple handling points.
Parcel carrier claims average 14–30 days for standard damage claims and 30–60 days for loss claims requiring investigation. FedEx and UPS have invested heavily in automated claim processing and typically issue first decisions within two weeks.
FTL claims average 30–60 days for straightforward damage claims; complex high-value losses requiring third-party inspection can extend to 90–180 days.
The 47-day average masks a critical operational problem: the claims that take longest to resolve are the high-value ones, and the claims that are abandoned before resolution are disproportionately the mid-size claims ($500–$5,000) where the follow-up cost exceeds the expected return under manual processes. An estimated 30% of filed freight claims are abandoned before final payout — not because they were denied, but because the shipper's ops team ran out of bandwidth to follow up at the 60-day stall point carriers reliably create.
Automated claims processes consistently reduce average resolution time to 14–21 days by eliminating the three most common delays: documentation submission lag, manual follow-up scheduling, and carrier response tracking. When a claim is submitted complete and followed up systematically, carriers have less procedural room to slow-walk the resolution.
What Percentage of Eligible Freight Claims Are Actually Filed?
This is the most consequential benchmark in this report — and the one that most operations teams have never measured.
Survey data from mid-market shippers consistently shows that fewer than 50% of clear claim-eligible exceptions result in a filed claim. A 2024 survey found that 42% of events where a shipper had documented damage, confirmed loss, or verified shortage — events where a claim would almost certainly succeed if filed — were never filed at all.
The barriers are consistent across company size and industry:
- Bandwidth: A single claims processor can handle 40–60 manual claims per month. A shipper moving 2,000 shipments per month with a 3% exception rate generates 60 potential claims monthly — and that's before accounting for the research required to determine which exceptions are actually claim-eligible.
- Value threshold: Many shippers have informal policies of not filing claims under $200–$500 because the documentation and follow-up time cost more than the expected recovery. These policies are rational under manual processing and irrational at scale.
- Uncertainty: Determining carrier deadlines, liability thresholds, and documentation requirements across 10–20 carrier relationships requires institutional knowledge that moves with people rather than systems.
- Low-value exception volume: A 3PL handling 10,000 shipments per month at a 2.5% exception rate has 250 potential claims monthly — at $50 average administrative cost per manual claim, filing them all costs $12,500 before any recovery is received.
The implication: the biggest single improvement available to most ops teams is not improving their denial rate — it's filing the 40–50% of claims they're currently abandoning before they start. At an average $1,200 claim value and a 65% recovery rate, 100 unfiled claims represents $78,000 in foregone recovery per month.
How Is Freight Claims Technology Evolving in 2026?
The freight claims technology landscape in 2026 is bifurcating between two generations of solution:
First generation: claims management software. Platforms like FreightClaims.net, Claimatic, and carrier-specific portal tools provide structured claim submission workflows, deadline tracking, and document management. These tools reduce the documentation failure rate but do not automate the detection, triage, or filing of claims — a human still has to notice the exception, decide to file, and initiate the process. Most mid-market shippers using first-generation tools report filing rates of 55–70% of eligible claims, up from the 50% manual baseline, but well short of the 95%+ ceiling.
Second generation: SOP-driven AI agents. The emerging architecture applies AI agents to the full claims lifecycle — detecting exceptions from TMS/WMS feeds, determining claim eligibility against carrier tariffs and SOP rules, assembling documentation from multiple systems (ERP, TMS, carrier portals, photo documentation tools), filing with the correct carrier through API or portal automation, and tracking payout through resolution. Teams using this approach report filing rates of 90–97% of eligible claims and recovery rates of 70–85%, up from the 35–45% manual baseline.
The critical architectural difference between first and second generation is not AI capability — it's system integration. First-generation tools manage claims in isolation. Second-generation agents execute workflows across the systems where claim data actually lives: the TMS for shipment records, the WMS for receiving documentation, the ERP for invoice values, Salesforce for customer account context, and the carrier portal for filing. Cross-platform case management is what makes automated claims viable at scale rather than just faster at the same manual steps.
Technology adoption data for 2026 shows approximately 28% of mid-market shippers using dedicated claims management software of any kind, and fewer than 8% using AI-powered automation. The adoption gap is the opportunity.
What Do the Numbers Mean for Shipper Operations in 2026?
The benchmarks above tell a consistent story: the gap between what shippers are recovering from freight claims and what they should be recovering is large, systematic, and almost entirely process-driven.
A mid-size shipper processing 500 claims per month at the industry baseline — 50% filing rate, 40% recovery rate, $1,200 average claim value — is collecting approximately:
500 exceptions → 250 filed claims → 100 paid recoveries → $120,000/month in actual receipts
The same 500 exceptions run through a best-in-class automated process:
500 exceptions → 475 filed claims → 356 paid recoveries → $427,200/month in actual receipts
The difference — over $300,000 per month, or $3.6 million annually — comes from three compounding improvements: filing rate from 50% to 95%, recovery rate from 40% to 75%, and abandonment rate from 30% to 5%. None of these improvements require negotiating better rates with carriers. They require better process execution.
How Should Ops Teams Close the Gap in 2026?
The freight claims benchmarks in this report point to four operational priorities for 2026:
1. Measure your actual filing rate. Most ops teams know their recovery rate but not their filing rate. Pull six months of exception data from your TMS and compare it to claim submissions in your claims management system. The gap is your single largest improvement opportunity.
2. Map your carrier deadline calendar. Build a reference document covering filing windows for every carrier in your network — visible damage, concealed damage, loss, shortage — and the notification requirements that must be met before formal filing. Carrier deadlines are the second-most-common denial trigger and the easiest to prevent with a documented SOP.
3. Standardize documentation collection at delivery. Implement a delivery receipt process that requires damage notation on POD for any exception, immediate photo documentation before packaging is disturbed, and same-day notification to your claims team. Automating shortage claims proof gathering at the point of delivery is the fastest single improvement most shippers can make.
4. Evaluate automation for your claim volume. At 100+ claims per month, the ROI case for freight claims automation is straightforward: the additional recovery from filing 40–50% more eligible claims typically covers implementation cost within 60–90 days. At 500+ claims per month, automation is table stakes rather than optional investment.
The $50 billion freight claims market is not a carrier problem that shippers are powerless to solve. It's a process problem with a documented, systematic solution — and 2026 is the year that solution becomes accessible to operations teams that aren't running Fortune 50 logistics networks.
Methodology and Data Sources
This report synthesizes freight claims benchmarks from multiple sources: industry association surveys (Transportation Intermediaries Association, National Industrial Transportation League), carrier-published tariff data, shipper operations interviews conducted in Q4 2025 and Q1 2026, analysis of freight claims management platform benchmarks, and CorePiper operational data from logistics clients processing freight claims across FedEx, UPS, USPS, DHL, and major LTL carriers. Statistics are presented as ranges where point estimates would overstate precision. Individual shipper outcomes vary based on freight mix, carrier relationships, and claims process maturity.
For a tactical deep-dive into automating the freight claims workflow end to end, see our guide on automating the 10-step freight claims workflow.
Mustafa Bayramoglu is the founder of CorePiper (YC W19), a platform that orchestrates SOP-driven AI agents across Salesforce, Zendesk, and Jira for enterprise case operations. He writes about logistics technology, freight operations, and AI automation for B2B ops teams.