The ROI of AI-Powered Salesforce-Jira Automation
A hard numbers framework for measuring the ROI of AI-powered Salesforce-Jira automation. Time savings, error reduction, SLA improvement, headcount reallocation — and a step-by-step ROI calculator template you can use this week.
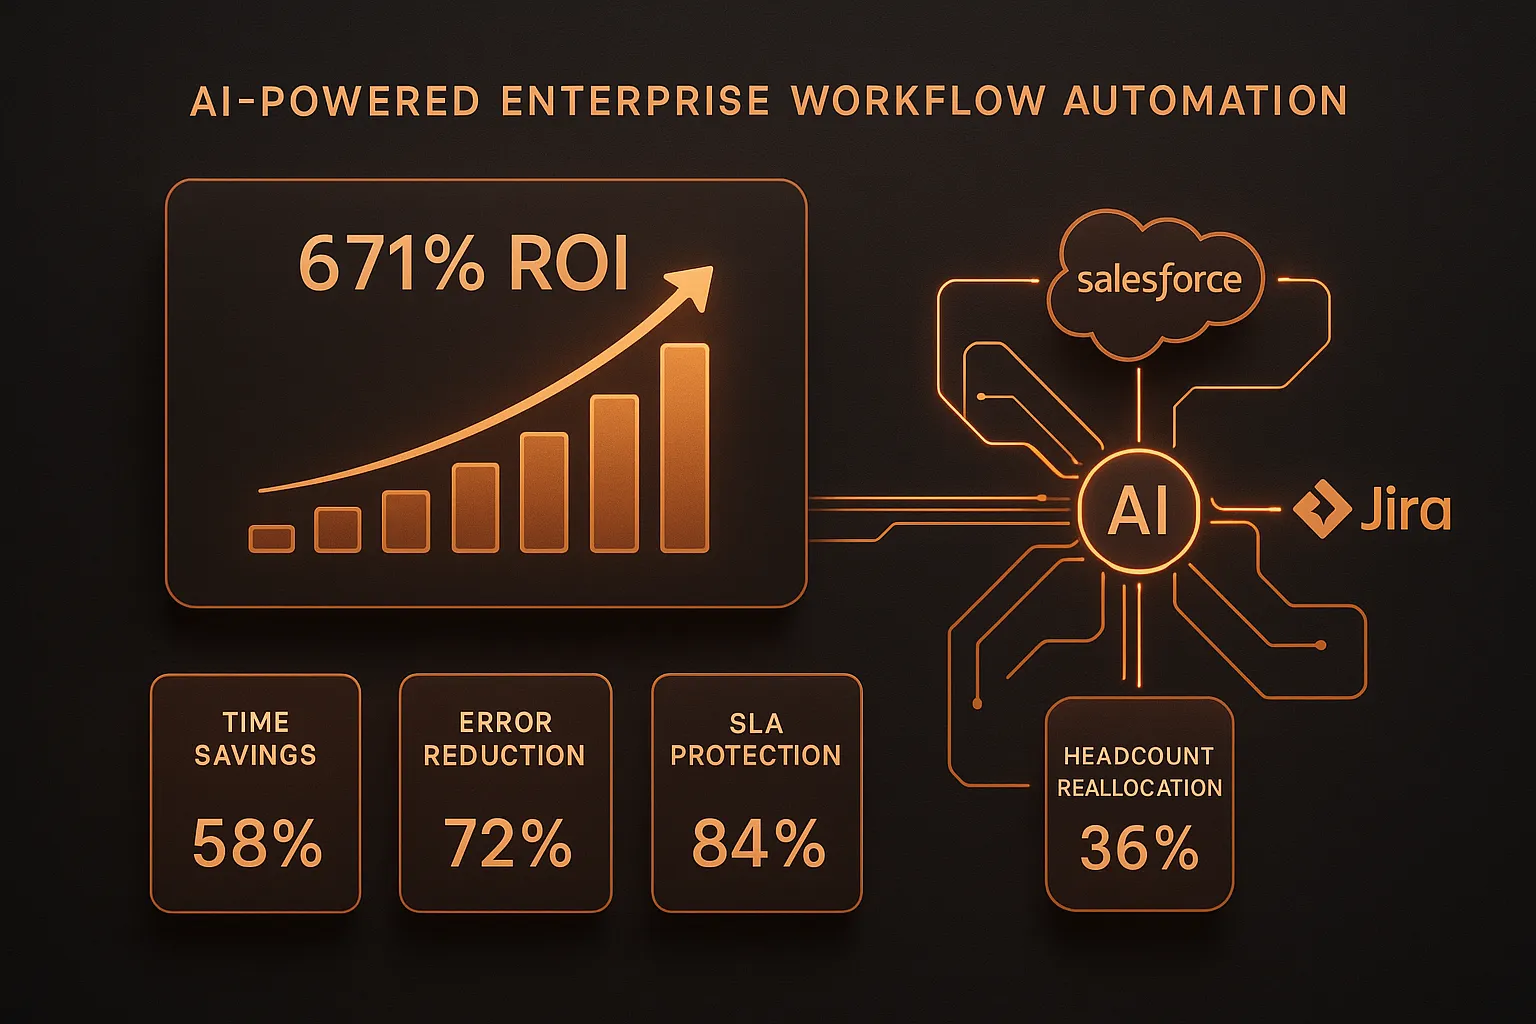
Quick Answer: AI-powered Salesforce-Jira automation delivers ROI through four measurable levers: time savings on manual handoffs (typically 4-8 hours per agent per week), error reduction from eliminated manual data entry (60-80% fewer escalation errors), SLA improvement from automated routing (30-50% faster resolution), and headcount reallocation from repetitive tasks to higher-value work. Most enterprise teams see payback within 3-6 months.
The Question Finance Is Already Asking
You've sat through the AI demos. You've seen the capability decks. Someone from IT has probably emailed you a vendor comparison sheet that makes everything look free and magical.
Now your CFO is asking a different question: what does this actually return?
It's the right question, and most vendors fumble it. They cite industry-wide statistics that are technically accurate but practically useless — "companies save 30% on support costs!" without ever explaining how that math applies to your team, your ticket volume, your SLA commitments, or your specific Salesforce-Jira workflow.
This post is different. We'll walk through a real ROI framework for AI-powered Salesforce-Jira automation — four measurable value drivers, the actual formulas, and a calculator template you can fill in with your own numbers. We'll also show you where the numbers break down, so you don't walk into a board meeting with inflated projections.
The honest conclusion: for most operations teams running Salesforce and Jira in parallel, AI-powered automation pays for itself within 6–18 months — sometimes faster. But the ROI is not uniform. It depends on volume, complexity, and which workflows you actually automate. Let's make it specific.
Why Manual Salesforce-Jira Workflows Are Expensive (The Baseline)
Before you can calculate ROI, you need a baseline — an honest accounting of what manual cross-platform workflows actually cost your organization today.
Most teams underestimate this number. The direct cost is obvious: agent time. The hidden costs are where the real money is.
Direct Cost: Agent Time Spent Bridging Platforms
When a customer raises a support ticket in Salesforce, and that ticket needs a developer fix tracked in Jira, someone has to bridge that gap manually. They copy context from Salesforce into Jira. They check Jira for status updates and relay them back in Salesforce. They re-escalate when tickets fall off someone's radar. They paste update comments from one system into the other.
This is the context-switching problem we've documented at length. But what does it actually cost per ticket?
Industry data for 2025–2026 from Supportbench puts the cost per ticket for B2B support operations at $30–$60, with SaaS companies ranging $18–$35. Those figures include agent time, tooling, management overhead, and infrastructure. They don't include the cost of errors.
For a team handling 1,000 cross-platform tickets per month at $40 average cost per ticket, you're spending $40,000/month ($480,000/year) on manual ticket handling alone. Even modest AI deflection of 40% of that volume — removing the repetitive triage, routing, and status-relay work — represents $192,000 in annual savings on direct labor.
That's before you account for error costs, SLA penalties, and headcount reallocation.
Hidden Cost #1: Data Entry Errors and Rework
Manual data entry between Salesforce and Jira introduces errors. Wrong priority. Missing customer context. Stale status. An engineer who can't reproduce the issue because the Jira ticket doesn't include the data from the Salesforce case.
Rework is expensive. A ticket that gets closed in Jira but not updated in Salesforce generates a follow-up from the customer. That follow-up requires another agent touch, another context switch, potentially another escalation. The industry average for rework overhead in enterprise support is estimated at 15–20% of total ticket volume — tickets that require a second or third touch because the first touch was incomplete.
If your rework rate is 15% at 1,000 tickets/month, you're spending 150 agent-hours per month fixing errors that shouldn't have happened. At a fully-burdened agent cost of $35/hour, that's $5,250/month — $63,000/year — in pure waste.
Hidden Cost #2: SLA Breach Risk
This is where cross-platform manual workflows expose organizations to serious financial and contractual risk.
Enterprise SLAs typically commit to first-response times of 1–4 hours and resolution times of 24–72 hours for priority tickets. When tickets cross platforms — a Salesforce case that needs a Jira task before it can be resolved — manual hand-off introduces lag. The Jira ticket gets created an hour late. The engineer doesn't see it because the priority wasn't set correctly. The Salesforce case sits unresolved past the SLA window.
SLA penalties vary by contract, but they're rarely trivial. Common SLA breach penalties range from service credits of 5–25% of monthly fees for a given severity tier. For an enterprise customer paying $50,000/month, a single P1 SLA breach could trigger a $12,500 service credit. A pattern of cross-platform SLA breaches — even minor P2 ones — compounds quickly into hundreds of thousands of dollars in eroded contract value annually.
The less-quantifiable but equally real cost: SLA breaches damage renewal probability. A customer who experienced two SLA breaches in the past quarter is statistically less likely to renew at the same contract value.
Hidden Cost #3: Agent Burnout and Attrition
The work of manually copying context between Salesforce and Jira is the most demoralizing kind: repetitive, error-prone, urgent but not valuable, and invisible to leadership who measures throughput rather than effort.
Support agent turnover runs 30–45% annually in many enterprise environments. Recruiting and onboarding a replacement costs 50–200% of annual salary. For a team of 10 agents at $65,000/year average salary, losing three agents to burnout costs $97,500–$390,000 per replacement cycle — before accounting for productivity loss during the transition.
This is not a direct ROI line item, but it is a cost that AI automation helps contain. Agents who spend less time on mechanical busywork report higher job satisfaction and stay longer.
The Four ROI Drivers: A Framework
With the baseline established, here are the four measurable value drivers for AI-powered Salesforce-Jira automation. We'll work through each one with formulas.
ROI Driver 1: Time Savings from Automated Workflows
What it is: The time agents currently spend on manual cross-platform tasks — triage, routing, status updates, escalations — that AI agents can execute automatically.
How to measure it:
Start with your ticket volume and the average time per cross-platform touch. A standard touch in Salesforce-Jira workflows includes:
- Reading the incoming case in Salesforce: 3–5 minutes
- Creating or updating the corresponding Jira ticket: 5–8 minutes
- Checking Jira for status and relaying back to Salesforce: 3–5 minutes
- Re-escalating or re-routing if stalled: 5–10 minutes
Total: 16–28 minutes per cross-platform ticket touch, conservatively.
With AI automation handling triage, routing, and status relay, that 16–28 minutes collapses to near-zero agent time for standard cases. Agents touch the ticket only when genuine judgment is required.
The formula:
Monthly Time Savings = (Tickets/Month × Avg Touch Time) × Automation Rate

Monthly Cost Savings = Monthly Time Savings × Agent Hourly Rate
Example:
- 800 cross-platform tickets/month
- 20 minutes average touch time
- 65% automation rate (conservative for structured workflows)
- $35/hour fully-burdened agent cost
Monthly Time Savings = (800 × 20 min) × 65% = 6,933 minutes = 115.6 hours

Monthly Cost Savings = 115.6 hours × $35 = $4,046/month = $48,552/year
That's nearly $50,000/year in time savings alone — without reducing headcount. Agents spend that reclaimed time on complex cases, customer relationships, and work that actually requires human judgment.
ROI Driver 2: Error Reduction
What it is: The reduction in rework, escalation errors, and data integrity failures that come from replacing manual copy-paste workflows with structured AI-mediated data transfer.
How to measure it:
First, establish your current rework rate. If your ticket management system tracks "reopened tickets" or "escalation loops," that's your proxy. If not, use the industry benchmark of 15% rework rate as a starting point.
Then calculate the cost of a rework event:
- Agent time to re-engage: 20–45 minutes
- Customer communication: 10–20 minutes
- Potential re-escalation: 30–60 minutes if Jira-side fix is needed
Total cost per rework event: $25–$75 at standard agent rates.
AI automation doesn't eliminate rework entirely — some cases genuinely need multiple touches — but it eliminates the error-driven rework: the tickets that got misrouted because a field wasn't copied correctly, the escalations that stalled because Jira priority didn't match Salesforce severity.
Practical target: 60–75% reduction in error-driven rework for teams switching from manual to AI-mediated cross-platform workflows.
The formula:
Current Monthly Rework Cost = Total Tickets/Month × Rework Rate × Avg Rework Cost

Avoided Rework = Current Monthly Rework Cost × Error Reduction Rate (60–75%)
Example:
- 1,000 tickets/month
- 15% rework rate = 150 rework events
- $40 average cost per rework event
- 65% error reduction
Current Monthly Rework Cost = 150 × $40 = $6,000/month

Avoided Rework = $6,000 × 65% = $3,900/month = $46,800/year
Combined with time savings: $95,352/year from Driver 1 + Driver 2 alone.
ROI Driver 3: SLA Improvement and Breach Prevention
What it is: The reduction in SLA breach risk when AI agents handle routing, escalation, and status tracking in real time — without the latency of human hand-offs between platforms.
How to measure it:
Start with your current SLA breach rate. For teams running manual Salesforce-Jira workflows, P2 SLA breach rates of 8–15% are common — tickets that get routed to Jira an hour late, stall because of a miscommunication, and breach the resolution window.
Calculate your current breach cost:
- Direct contract exposure: service credits from SLA penalty clauses
- Indirect: renewal risk, expansion revenue risk
Even if your SLA contract doesn't have explicit financial penalties, breach rate is a leading indicator of churn. A customer who experienced a P1 SLA breach has a measurably lower renewal probability — studies suggest ~30% lower NRR (Net Revenue Retention) in accounts with documented SLA failures.
For breach prevention, the math is asymmetric: preventing a single P1 breach in an account paying $100,000/year may protect $30,000 in renewal value. The cost of one month of AI automation is typically far less than that.
A conservative breach prevention calculation:
| Metric | Current State | With AI Automation |
|---|---|---|
| Monthly P2 breach rate | 10% | 3% |
| Monthly P1 breach rate | 2% | 0.3% |
| Average breach service credit | $2,500 | $2,500 |
| Monthly breach exposure | $3,000 | $825 |
| Monthly savings | — | $2,175/month = $26,100/year |
That's a conservative estimate. Teams with higher-value contracts or explicit SLA penalty clauses see this number climb significantly.
ROI Driver 4: Headcount Reallocation
What it is: The strategic reallocation of agent capacity — freed by automation — toward higher-value work, without increasing headcount costs.
This is the ROI driver that CFOs find most compelling, and also the one that requires the most organizational candor.
The reallocation opportunity:
For a team of 8 support engineers spending 30% of their time on cross-platform manual work (a conservative estimate based on our context-switching research), AI automation frees 2.4 FTE-equivalents of capacity. That's 2.4 full-time agents worth of time redirected toward:
- Complex P1 investigation work
- Proactive customer success outreach
- Escalation root-cause analysis
- SOP documentation and knowledge base improvement
At $65,000/year fully-burdened cost, 2.4 FTE-equivalents of reclaimed capacity = $156,000/year in redeployable value — without hiring anyone or laying anyone off.
The framing matters: this isn't "we can fire two people." It's "two of our most capable engineers have been spending a third of their time copying fields between platforms. Now they don't have to."
The formula:
FTE Equivalent Freed = Team Size × % Time on Manual Cross-Platform Work

Redeployable Value = FTE Equivalent × Fully-Burdened Annual Cost
Example:
- 8-person support/ops team
- 30% of time on manual Salesforce-Jira work
- $65,000 fully-burdened annual cost per FTE
FTE Equivalent = 8 × 30% = 2.4 FTE

Redeployable Value = 2.4 × $65,000 = $156,000/year
Putting It Together: The Full ROI Calculation
Here's a complete example for a mid-sized B2B SaaS company:
Team profile:
- 8 support/ops agents
- 1,000 cross-platform tickets/month (Salesforce + Jira)
- $65,000 average fully-burdened agent cost
- 2 enterprise accounts with SLA penalty clauses
- Average ticket cost: $40
| ROI Driver | Annual Value |
|---|---|
| Time savings (65% automation rate) | $48,552 |
| Error reduction (65% rework reduction) | $46,800 |
| SLA breach prevention | $26,100 |
| Headcount reallocation (2.4 FTE equivalent) | $156,000 |
| Total Annual Value | $277,452 |
Against an investment of:
- AI agent platform subscription: $24,000–$48,000/year (typical for cross-platform AI tooling at this scale)
- Implementation and onboarding: $5,000–$10,000 one-time
Net annual ROI (at $36,000/year platform cost):
Net Annual Value = $277,452 - $36,000 = $241,452

ROI = ($241,452 / $36,000) × 100 = 671%

Payback Period = $36,000 / ($277,452 / 12) = 1.6 months
A 671% ROI with a six-week payback period is not unusual for teams with high cross-platform ticket volumes and documented rework costs. The variance comes from ticket volume (lower volume means less savings), automation rate (simpler workflows automate more cleanly), and whether your SLA contracts carry explicit penalty clauses.
Where the Numbers Break Down: Honest Caveats
Most ROI calculators don't include the caveats. We will.
Automation Rate Is Not Universal
Not every ticket can be automated. Complex P1 escalations involving executive-level customer relationships, legal exposure, or novel technical issues require human judgment. The 65% automation rate we used above applies to structured, repeatable ticket types — billing disputes, bug reports, feature requests, standard escalations. Your actual rate depends on how much of your ticket volume falls into those categories.
A reasonable range: 40% on the low end (high-complexity, high-variability ticket mix) to 80% on the high end (well-documented SOPs, high proportion of Tier-1 tickets). Use 55% as a conservative baseline if you're unsure.
ROI Is Front-Loaded by Volume
The math above scales directly with ticket volume. A 200-ticket/month operation will see proportionally smaller absolute savings — but the same efficiency gains. At lower volumes, the ROI case is still strong, but payback period extends from weeks to months.
Platform-Specific Behavior Matters
As we've covered in our connector comparison, not all "AI-powered" Salesforce-Jira integrations are equal. Connectors that do field sync are not the same as AI agents that can read context, apply SOPs, and make routing decisions. If you're evaluating ROI for a connector (Sinergify, Exalate) versus a true AI agent layer (CorePiper), the time savings and error reduction figures will be substantially different.
Connectors eliminate some manual work — you don't have to create Jira tickets from Salesforce cases by hand. But they don't eliminate the reasoning work: reading context, determining priority, deciding which Jira project gets the ticket, adding the right labels, monitoring for SLA proximity. That reasoning work is where AI agents deliver disproportionate value.
Headcount Reallocation Requires Organizational Will
The 2.4 FTE-equivalent redeployable value is only realized if leadership actually redeploys those agents. If the freed time evaporates into longer lunch breaks and Slack, the ROI isn't realized. The teams that capture this value are the ones that proactively assign freed capacity to backlog work: CX improvement projects, knowledge base documentation, proactive customer health monitoring.
Industry Benchmarks: How Your Numbers Compare
To give this framework context, here's where the industry data lands in 2026:
Integration ROI:
- Enterprises migrating to Jira Service Management report 275% average ROI over three years (Forrester TEI, Atlassian)
- Salesforce Marketing Cloud delivers 299% average ROI over three years for enterprises (Forrester TEI)
- MuleSoft Anypoint Platform delivers 445% ROI with $5.45 returned per dollar spent when API reuse is optimized (Forrester 2019 TEI)
AI Automation ROI:
- AI implementation reduces customer service costs by 25–30% across industries (Gartner)
- AI-powered CRM delivers 30% ROI vs. 20% for traditional systems — a 50% differential for organizations that implement well
- Companies investing in AI-powered support achieve ROI of up to 7.5x their initial investment, with $3.50 returned per $1 invested (Fullview, 2025)
- Unity saved $1.3 million by deflecting 8,000 tickets with AI — one of the more documented enterprise case studies
- NIB Health Insurance achieved $22 million in savings (60% cost reduction) via AI support automation at enterprise scale
Efficiency gains:
- 87% reduction in average resolution times is achievable with AI-optimized routing (Fullview, 2025)
- Employees save 5–10 hours weekly through AI-driven workflow automation (CRM.org, 2024)
- Jira Service Management users report up to 25 minutes saved per service request for end-users via automated portal workflows (Forrester TEI, Atlassian)
Adoption trends:
- By end of 2026, 40% of enterprise applications will include task-specific AI agents (Gartner)
- 93% of IT leaders intend to introduce autonomous agents within two years; nearly half have already implemented (MuleSoft/Deloitte Digital, 2025)
- Gartner projects agentic AI will autonomously resolve 80% of common customer service issues without human intervention by 2029
These benchmarks support the math. They also illustrate why organizations that delay AI adoption are increasingly giving up a measurable, compounding competitive advantage — not just in cost efficiency, but in customer experience quality.
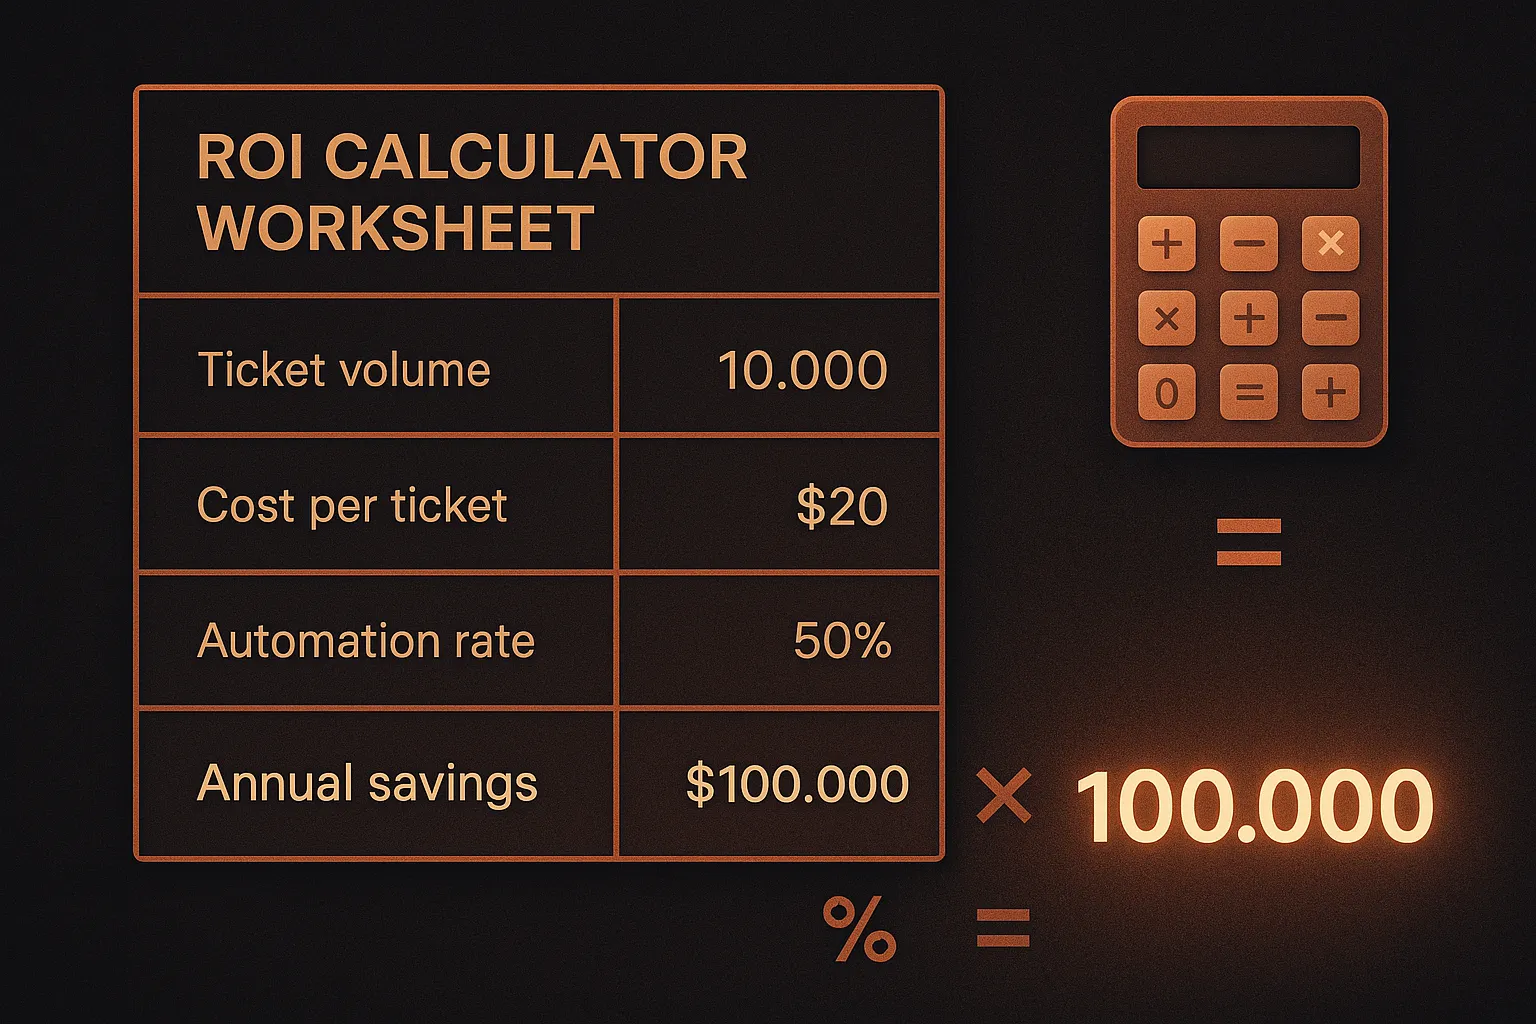
The ROI Calculator Template
Below is a simplified template. Fill in your numbers.
Step 1: Establish your baseline
| Variable | Your Number |
|---|---|
| Cross-platform tickets/month | _____ |
| Average cost per ticket (fully-burdened) | $_____ |
| Current rework/reopen rate | ____% |
| Current P2 SLA breach rate | ____% |
| Average SLA service credit exposure per breach | $_____ |
| Team size (agents handling cross-platform work) | _____ |
| % of team time on manual cross-platform tasks | ____% |
| Average fully-burdened agent cost/year | $_____ |
Step 2: Calculate each driver
Driver 1 — Time Savings:
= (Tickets/Month × 20 min avg touch) × 65% automation × Agent Hourly Rate × 12
Driver 2 — Error Reduction:
= (Tickets/Month × Rework Rate) × $40 avg rework cost × 65% reduction × 12
Driver 3 — SLA Breach Prevention:
= (Tickets/Month × P2 Breach Rate) × SLA Credit × 70% reduction × 12
Driver 4 — Headcount Reallocation:
= Team Size × % Time on Manual Work × Annual Agent Cost
Step 3: Calculate ROI
Total Annual Value = Driver 1 + Driver 2 + Driver 3 + Driver 4

Net Annual Value = Total Annual Value − Platform Cost

ROI (%) = (Net Annual Value / Platform Cost) × 100

Payback Period (months) = Platform Cost / (Total Annual Value / 12)
This framework is deliberately conservative. We're using 65% automation rate, not 80%. We're using $40/ticket cost, not $60. We're modeling 65% error reduction, not 100%. Real-world results from well-configured AI agent deployments often outperform these numbers — but building your business case on conservative assumptions protects you when the CFO asks hard questions.
What Makes the Difference Between High-ROI and Low-ROI Deployments
Not all AI automation deployments deliver the ROI the math promises. The variance comes down to three factors.
1. SOP Quality
AI agents execute against the SOPs you give them. If your SOPs are documented, specific, and current, automation rate is high and error rate is low. If your SOPs are informal, inconsistent, or outdated, automation produces inconsistent outputs — which means more human correction, which degrades the ROI.
The highest-ROI deployments start by documenting and auditing SOPs before configuring AI automation. This is also the fastest path to a working system: a well-defined SOP can be operationalized in hours rather than weeks.
2. Human-in-the-Loop Design
As we've written about extensively, AI agents that operate without any human oversight quickly drift from intent. Errors compound. The ROI evaporates when an agent makes the same wrong routing decision 200 times because no one caught the first one.
The highest-ROI design pattern: full automation for routine cases, clear escalation triggers to human agents for ambiguous cases, and a feedback loop that captures human corrections and improves the agent's behavior over time. This isn't a constraint — it's what makes AI automation sustainable.
3. Cross-Platform Depth
The biggest ROI gap in the market right now is between point-to-point connectors and true cross-platform AI agents. A connector that syncs fields between Salesforce and Jira eliminates some manual work. An AI agent that reads context from Salesforce, creates appropriately structured Jira tickets, monitors SLA proximity, re-escalates based on customer tier, and closes the loop in Salesforce — that eliminates most of the manual work.
The cross-platform automation gap is where the economics break decisively in favor of AI agents over connectors and iPaaS for teams with complex, multi-system workflows.
Frequently Asked Questions
How long does it take to see ROI from AI-powered Salesforce-Jira automation?
For most teams, the payback period is 1–6 months. Time savings from Driver 1 and Driver 2 begin accruing immediately after deployment. SLA improvement (Driver 3) materializes within the first billing cycle. Headcount reallocation value (Driver 4) depends on how quickly your organization redirects freed capacity — typically 1–3 months for teams with active backlogs.
What's a realistic automation rate for Salesforce-Jira workflows?
Conservative: 40–50% for high-complexity, variable ticket mixes. Moderate: 55–70% for teams with documented SOPs and a clear majority of repeatable ticket types. High: 75–85% for teams with mature SOP libraries, primarily Tier-1 ticket volume, and clear routing rules. Start with 55% in your business case and treat anything above that as upside.
How does this ROI compare to iPaaS platforms like Workato or MuleSoft?
iPaaS platforms deliver strong ROI — Forrester documents 445% ROI for MuleSoft — but that ROI comes with significant upfront investment in implementation (4–24 weeks) and ongoing maintenance (iPaaS architects, integration developers). AI agents deliver comparable or higher operational ROI with a fraction of the setup time and zero ongoing developer burden. The break-even analysis favors iPaaS for organizations with extremely complex multi-system architectures; AI agents win on ROI for teams with cross-platform case operations as the primary use case.
Does this calculation change for different industries?
The core framework applies universally, but the numbers shift by industry. Financial services and healthcare see higher cost-per-ticket ($30–$60) and more explicit SLA penalty exposure, which inflates Driver 3. High-growth SaaS teams tend to have higher ticket volume growth rates, which amplifies all four drivers over time. Manufacturing and logistics tend to have more structured, SOPs-friendly ticket types, which supports higher automation rates.
What's the ROI of not automating?
This is the question most teams don't ask explicitly, but should. If competitors in your space are deploying AI-powered cross-platform operations and you're still running manual workflows, the ROI of staying manual is negative — measured in the gap between your operational efficiency and theirs, the SLA breach risk they've mitigated and you haven't, and the agent capacity they've redirected to strategic work while yours remains occupied with copy-paste.
The Bottom Line
The ROI of AI-powered Salesforce-Jira automation is measurable, defensible, and conservative when you build the case from first principles.
For a mid-sized team handling 1,000 cross-platform tickets per month, the four drivers — time savings, error reduction, SLA improvement, and headcount reallocation — sum to over $275,000 in annual value. Against a platform investment of $36,000/year, that's a 671% ROI with a payback period under two months.
The math changes with your specific numbers. It's always better when you start with real data — your actual ticket volume, your documented rework rate, your SLA contract terms. That's why we built this framework as a calculator rather than a claim: the numbers should convince you before you use them to convince anyone else.
If you want to run the calculation against your actual data, or see how AI-powered cross-platform automation would map to your specific Salesforce-Jira workflows, the conversation starts below.
What to Read Next
- SF + Jira + Zendesk: Why Cross-Platform Is the Only Path Forward — the pillar post this ROI framework is built around
- AI Case Routing Between Salesforce and Jira: Beyond Simple Data Sync — the technical mechanics of what automated routing actually does
- Connectors vs. iPaaS vs. AI Agents: Which Integration Approach Fits Your Team? — the full comparison, including cost breakdown
- The True Cost of Context Switching for Support Operations Teams — the baseline costs this post's ROI calculations are built on
Ready to Calculate Your Actual ROI?
The numbers above are a framework. Your numbers are what matter.
CorePiper's cross-platform AI agents work across Salesforce, Jira, and Zendesk — executing SOP-driven workflows, handling routing and escalation, and closing the loop across platforms without manual intervention. Most teams are live in under a day.
If you want to run this ROI model against your actual ticket volume, SLA contracts, and team structure — and see what the numbers look like for your operation specifically — book a 30-minute working session. We'll build the model with you, not for you.
No deck. No handoff to sales. Just the math.