
What Is AI Deflection Rate? Definition, Benchmarks, and Why It's the Wrong Primary Metric (2026)
AI deflection rate is the percentage of customer contacts that never reach a human agent. Here's the 2026 definition, industry benchmarks, and why optimizing for deflection alone backfires.
 Mustafa BayramogluAugust 13, 202611 min read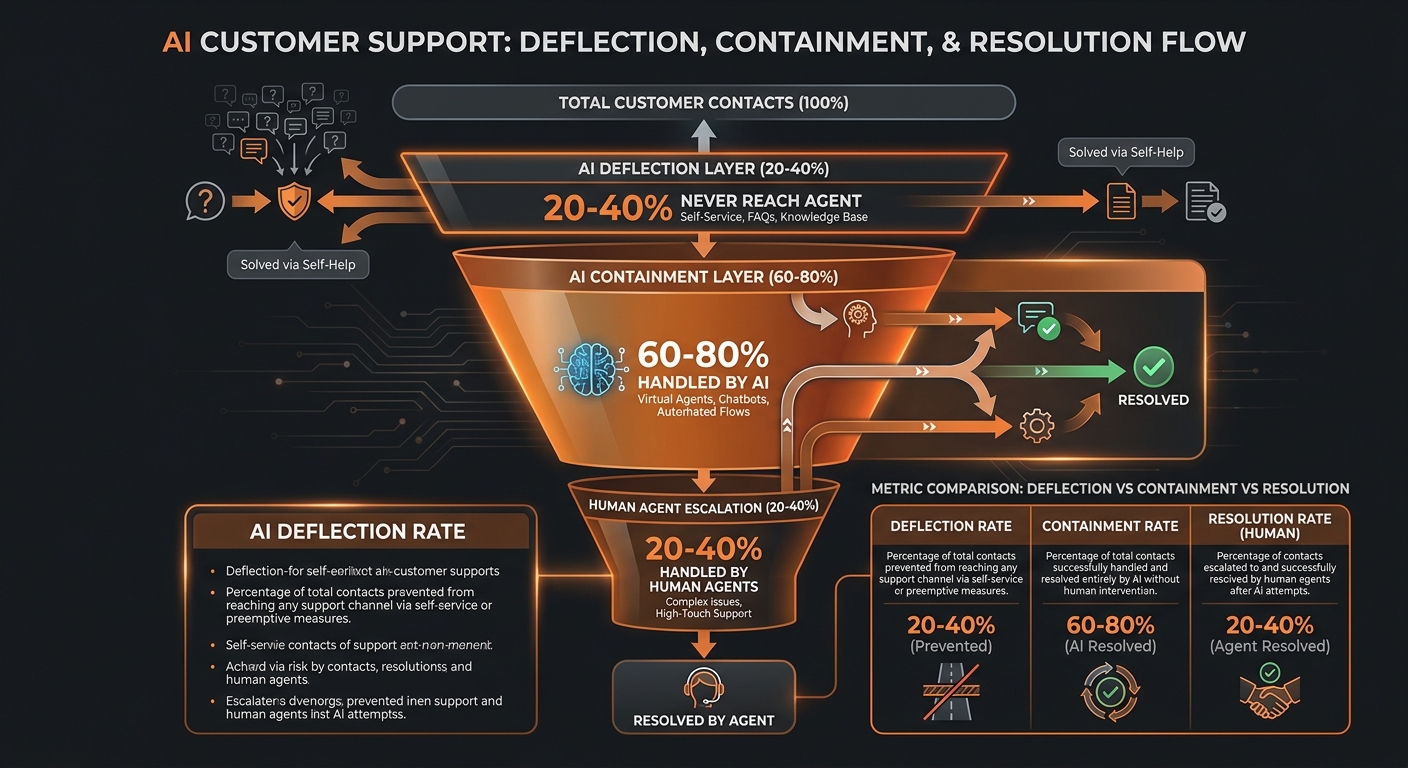
What Is AI Deflection Rate? Definition, Benchmarks, and Why It's the Wrong Primary Metric (2026)
AI deflection rate is the percentage of potential customer contacts that never reach a support agent — human or AI — because the customer found their answer through self-service, received a proactive notification, or abandoned the contact attempt. In 2026, well-run e-commerce and logistics support operations achieve deflection rates of 20–40% through proactive notifications and quality knowledge bases, reducing total inbound contact volume before a ticket is ever opened.
TL;DR: Deflection Rate vs. Containment Rate vs. Resolution Rate
| Metric | What it measures | Point in funnel | Typical range | Primary use |
|---|---|---|---|---|
| Deflection rate | Contacts that never reach an agent | Before ticket opened | 20–40% (e-commerce) | Volume reduction |
| Containment rate | Conversations handled by AI without human escalation | After ticket opened | 60–85% (agentic AI) | AI quality |
| Resolution rate | Issues that were actually solved | After interaction | 65–90% | Customer outcome |
| Escalation rate | Conversations that required a human | After ticket opened | 15–40% | Human workload |
The key insight: deflection and containment both reduce human-handled volume, but from different positions in the funnel — and only resolution rate confirms the customer's problem was actually fixed.
What Does AI Deflection Rate Actually Measure?
Deflection rate captures everything that happens before a support conversation starts. A potential contact is deflected when:
- The customer searches the help center and finds their answer without contacting support
- A proactive shipment or delivery notification answers the customer's question before they think to ask it
- The customer clicks through an FAQ page or status page and abandons the contact attempt
- A pre-chat widget answers the question before a conversation opens
- The customer gives up and does not contact support at all (the ambiguous case — solved or abandoned?)
What deflection rate does not measure: whether the deflected contact was successfully resolved. This is the critical limitation. A customer who closes a help article halfway through is counted as deflected regardless of whether they found their answer. A customer who receives a proactive "your package is delayed" notification is deflected — but if the notification doesn't explain what happens next, the customer may submit a ticket anyway later, inflating re-contact rates.
This is why deflection rate is a volume metric, not a quality metric.
How Is Deflection Rate Calculated?
The standard formula:
Deflection rate = (contacts deflected ÷ total contact attempts) × 100
The measurement challenge is what counts as a "contact attempt." Two definitions are used in practice:
Broad definition: Any customer who visits a help center or support widget but does not submit a ticket or open a conversation. This inflates deflection rate because it includes customers who browsed but were not actually seeking help.
Narrow definition: Contacts where the customer began a support interaction (clicked "Contact Us," opened a chat widget, started filling out a form) but resolved their issue before submitting. This is closer to a true deflection but requires tracking interaction intent before ticket submission.
Most platforms report deflection using whichever definition makes the number higher. When evaluating a vendor's deflection rate claims, ask which definition they apply and whether abandoned contacts are counted as deflected.
AI Deflection Rate Benchmarks by Context
E-commerce support (Shopify, DTC brands)
- Without proactive notifications: 10–20% deflection. Customers typically contact support as a first resort because the order status page doesn't answer nuanced questions (exceptions, delays, returns eligibility).
- With proactive shipment notifications: 30–50% deflection on WISMO-class queries. Proactive "your package is delayed" or "your order shipped" notifications prevent the contact before it starts.
- With knowledge base + proactive: 35–55% deflection across all query types. Self-service handles FAQ-class queries (return policy, sizing, payment methods); proactive handles post-purchase status queries.
Logistics and freight claims (B2B case operations)
Deflection rates are structurally lower in enterprise freight and claims environments because:
- Claims require affirmative action from the shipper — a claim must be filed, not just answered
- Case operations involve multi-system data (TMS, carrier portals, WMS) that isn't surfaced in a knowledge base
- Enterprise buyers expect account-level service, not self-service routing
Deflection rates of 10–20% are typical for logistics case operations. The operative metric is containment rate — what percentage of cases the AI handles without human escalation, not what percentage are prevented from reaching the system at all.
Contact center benchmarks (cross-industry)
Industry research across contact centers suggests 20–30% deflection is common for organizations with mature self-service investments and proactive communications programs. Rates above 40% require systematic effort: high-quality knowledge bases, proactive notification programs, and self-service tools that can actually take action (order modifications, return initiations, appointment bookings) rather than just providing information.
Why Deflection Rate Is the Wrong Primary Metric
Deflection rate became a popular KPI because it's easy to calculate and moves in the right direction when self-service investment increases. But optimizing for deflection rate as the primary metric creates three compounding problems:
Problem 1: Deflection rate doesn't distinguish between solved and abandoned
A customer who gives up trying to file a damage claim because your help center doesn't explain the process is counted as a deflected contact. So is a customer who found the answer in 30 seconds. Deflection rate treats these identically. The only way to know which is which is CSAT data on deflected sessions — which most teams don't collect.
Problem 2: Deflection rate can be gamed by making support hard to find
Remove the "Contact Us" button from the homepage. Add more steps to the ticket submission form. Route all chat widget inquiries through three rounds of FAQ suggestions before allowing an agent conversation. Deflection rate rises. Customer experience deteriorates. Support teams that report deflection rate as a primary KPI create incentives to reduce contact accessibility rather than improve resolution quality.
Problem 3: Deflection rate ignores repeat contacts
A customer whose question was "deflected" but not resolved contacts support again — sometimes multiple times. Repeat contacts add a ~2.3× multiplier to the true cost of handling that issue. A 40% deflection rate that generates 30% re-contact rates has effectively negative value: it defers the contact, degrades the experience, and adds handling cost through multiple interactions.
The correct primary metrics are resolution rate (was the problem solved?) and containment rate (did the AI handle the conversation without human escalation?). Deflection rate is a useful secondary metric for sizing self-service investment and proactive notification ROI, not a proxy for support quality.
What Proactive Notifications Do to Deflection Rate
Proactive post-purchase communications are the highest-ROI deflection lever available to e-commerce and logistics operations teams. When a customer receives accurate, timely information before they think to ask for it, the contact never happens — and the customer's experience is better than if they'd had to contact support.
The impact by notification type:
Order confirmation with tracking link: Reduces "where's my order" contacts in the first 24 hours by 20–35% for standard shipments.
Shipment exception notification ("your package is delayed, here's why and what happens next"): This is the highest-value proactive message. Without it, most customers contact support within hours of seeing a delivery exception in their tracking portal. With a proactive exception notification that includes an updated ETA and a clear next step (claim filing, rerouting, replacement), 50–70% of those contacts never arrive.
Delivery confirmation with return policy reminder: Reduces "I need to return this, how do I?" contacts by 15–25% in the 48 hours after delivery.
Proactive claim status updates for freight and logistics: In B2B case operations, proactive case status emails ("your claim is under review, expected resolution by [date]") reduce inbound status inquiries by 40–60% during the claim processing window.
The WISMO automation guide covers the full notification playbook and the decision logic for routing exception cases to proactive resolution vs. AI-handled ticket resolution when self-service isn't sufficient.
How Deflection Rate, Containment Rate, and Resolution Rate Work Together
The three metrics form a sequential funnel, each covering a different stage of the support experience:
Stage 1 — Before contact: Deflection rate. Did self-service, proactive notifications, or knowledge base content prevent the contact from being submitted? Target: 20–40% deflection for e-commerce, lower for B2B case operations.
Stage 2 — During contact: Containment rate. Of the contacts that did arrive, did the AI handle them end-to-end without human escalation? Target: 65–85% containment for agentic AI handling structured query types.
Stage 3 — After contact: Resolution rate. Was the customer's problem actually solved — not just deflected, not just contained, but genuinely resolved? Target: 65–90%, tracking within 10 percentage points of containment rate.
The compound effect: a support operation with 30% deflection and 75% containment handles 47.5% of total contact volume with human agents (30% deflected, 52.5% remaining × 75% contained by AI = 39.4% AI-contained, leaving 13.1% to humans). If resolution rate on human-handled contacts is 90%, the operation's overall resolution rate across all potential contacts is approximately: 75% (AI-resolved) + 11.8% (human-resolved) = approximately 87% of all inbound potential contacts.
These compound outcomes are why operations teams should model all three metrics together when evaluating AI support investments, rather than picking one to optimize in isolation.
How to Improve Deflection Rate Without Sacrificing Resolution Quality
1. Build a structured knowledge base around your most common queries. For e-commerce, the highest-deflection content is: return policy with eligibility criteria, tracking page with exception definitions, order modification window, payment failure explanations. Each piece of content should be findable within two clicks from the support entry point and should answer the question completely — not route to a contact form.
2. Implement proactive shipment and order communications. Every brand processing more than 500 orders per month should have automated post-purchase notification sequences: shipping confirmation, out-for-delivery alert, delivery confirmation, and exception notifications. This is the single highest-ROI deflection investment for WISMO-heavy queues.
3. Add self-service actions, not just information. Knowledge base articles about how to return an item reduce contacts less than a self-service return portal where the customer can initiate the return directly. The more actions your self-service layer can execute — return initiation, exchange request, address change within the modification window — the higher your deflection rate and the better your customer experience.
4. Track deflection quality separately. Implement CSAT prompts on deflected sessions ("Did you find what you needed?") and monitor re-contact rates for customers who were classified as deflected. A deflection rate of 40% with a 70% "found what I needed" score and 15% re-contact rate is healthy. A deflection rate of 40% with a 40% "found what I needed" score and 35% re-contact rate means you're preventing contacts but not solving problems.
5. Do not optimize deflection rate in isolation. Set a target range for deflection (20–40% for most e-commerce operations) and treat it as a constraint rather than a goal. The primary optimization target should be resolution rate across all contact types — deflected, AI-contained, and human-handled.
Deflection Rate and the AI Containment Rate Together
These two metrics are the most commonly confused in AI support vendor conversations. Here's the quick reference:
| Question | Deflection rate answers it | Containment rate answers it |
|---|---|---|
| How many contacts did we prevent? | ✓ | — |
| How many contacts did the AI handle? | — | ✓ |
| Did the customer's problem get solved? | ✗ (use resolution rate) | ✗ (use resolution rate) |
| Is our self-service investment working? | ✓ | — |
| Is our AI agent capable? | — | ✓ |
| Should we hire more agents? | Partially | ✓ |
When a vendor leads with deflection rate as their primary success metric, ask for containment rate and resolution rate data. Deflection tells you how many contacts they avoided; containment and resolution tell you whether the contacts that did arrive were handled well. The SOP-driven AI architecture that powers the highest containment rates — agents that follow documented procedures and take action across connected systems — is also the architecture most likely to produce high resolution rates, because resolution requires action, not just information retrieval.
Deflection rate is a useful operational metric for sizing self-service investment and evaluating proactive notification ROI. It is not a measure of AI support quality. The teams that make the most durable progress on support cost reduction and customer experience are the ones tracking all three funnel metrics together — deflection, containment, and resolution — and treating resolution rate as the metric that actually matters.
Mustafa Bayramoglu is the founder of CorePiper (YC W19). He writes about AI agents, enterprise case operations, and the logistics technology stack.