
What % of Revenue Should Ecommerce Support Cost? 2026 Benchmarks by Company Size
Ecommerce support should cost 2–8% of revenue for most brands — but SMBs routinely spend 10–25%. This benchmark post breaks down the right support cost ratio by GMV tier, with the math behind what drives overspend and how AI automation changes the curve.
 Mustafa BayramogluAugust 27, 202615 min read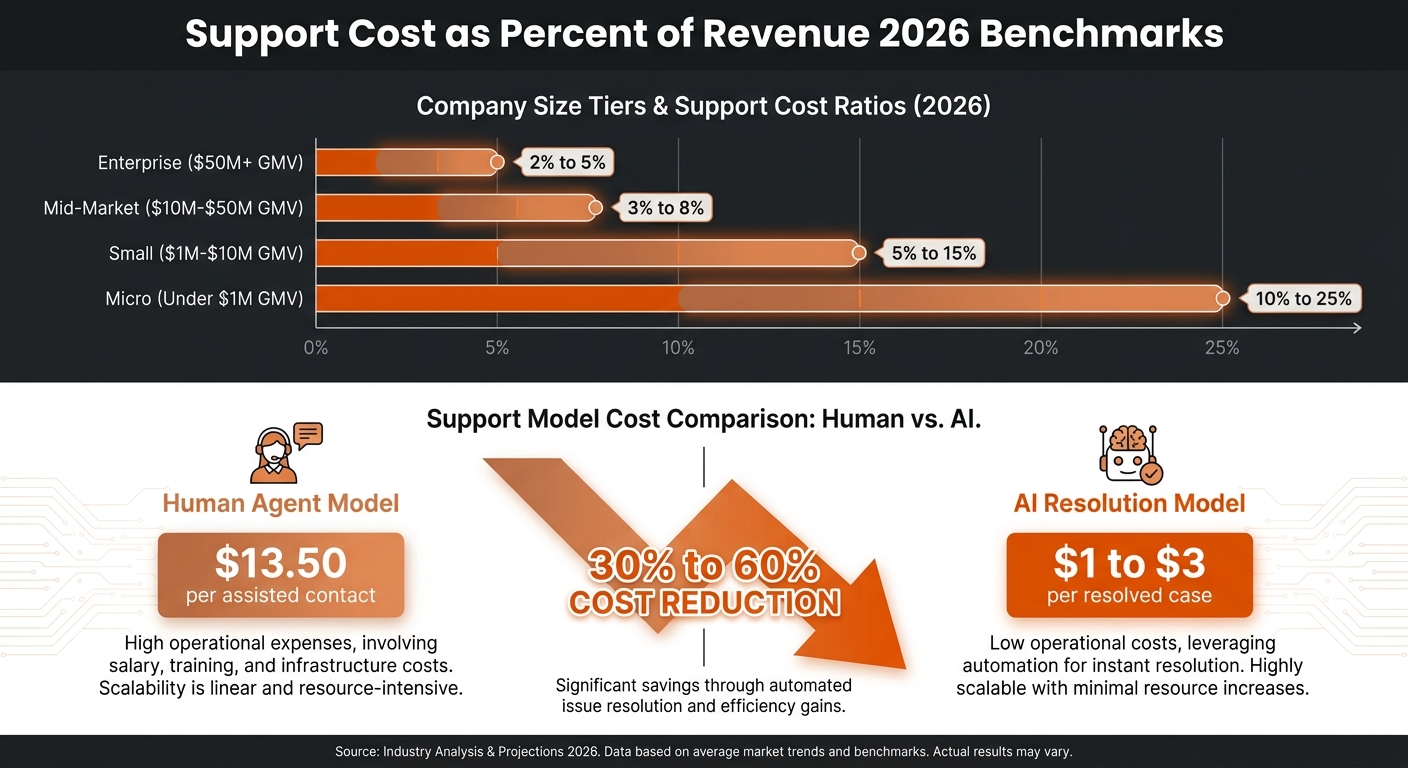
What % of Revenue Should Ecommerce Support Cost? 2026 Benchmarks by Company Size
Ecommerce support should cost 2–8% of revenue for most brands, but the right benchmark depends heavily on order volume, ticket mix, and resolution model. SMBs routinely spend 10–25% of GMV on support — not because they run inefficient teams, but because support has fixed-cost floors that do not scale down with order count. This post benchmarks the right support cost ratio by GMV tier and shows where automation changes the curve.
TL;DR: Support Cost as % of Revenue — Quick Benchmarks
| Company Size | Typical GMV | Support Cost as % of Revenue | Primary Driver |
|---|---|---|---|
| Micro | Under $1M | 10–25% | Fixed staffing overhead relative to low order volume |
| Small | $1M–$10M | 5–15% | Partially scaled; still reliant on human agents for most tickets |
| Mid-market | $10M–$50M | 3–8% | Beginning to see scale efficiencies; automation ROI positive |
| Enterprise | $50M+ | 2–5% | Automation, outsourcing, or both; ticket-to-order ratio flattening |
| Best-in-class (AI-automated) | Any | 1–3% | End-to-end resolution on 60–85% of tier-1 tickets at sub-$3/case |
The sections below break down the math behind each tier, identify the inflection points where support cost ratios shift, and show what automation levers move the ratio from the SMB curve to the enterprise curve.
What Is the Right Benchmark for Support Cost as a % of Revenue?
How Does Company Size Affect Support Cost Ratios?
Support cost as a percentage of revenue follows a predictable curve as order volume scales: the ratio is high at low volumes, falls sharply through the mid-market range, and flattens at enterprise scale. The curve exists because support has significant fixed-cost components — helpdesk software, minimum viable staffing, tooling, and training overhead — that do not shrink proportionally when order count declines.
Micro brands (under $1M GMV, typically under 300 orders/month)
At low order volumes, even a single part-time support agent can consume 10–20% of GMV. A brand doing $80,000/month in revenue with 250 orders/month at a 10% contact rate handles approximately 25 tickets per month. A part-time support employee at $2,500/month handles those 25 tickets at a cost of $100 per ticket — before factoring in helpdesk software, returns processing, or management time. The result: support costs routinely run 10–25% of GMV at micro-brand scale, and the economics do not improve until order volume grows or ticket-per-order ratio falls through proactive contact suppression.
Small brands ($1M–$10M GMV, roughly 300–3,000 orders/month)
As order volume crosses 500 orders/month, a dedicated support role becomes defensible. At 1,000 orders/month with a 12% contact rate, the brand handles approximately 120 tickets/month. A full-time support agent at $4,500/month handles those tickets at a blended cost of approximately $37.50 per ticket — or approximately 4.5% of $100,000 monthly GMV. The ratio improves as volume grows, but the staircase structure of headcount means cost jumps whenever a new hire is required.
Most small brands in this tier spend 5–15% of revenue on support, with the high end driven by high-contact-rate product categories (apparel, electronics, high-value home goods) and the low end achieved by brands with low return rates and proactive order tracking that suppresses WISMO volume.
Mid-market brands ($10M–$50M GMV, 3,000–15,000 orders/month)
At mid-market scale, the economics begin to favor automation. A brand at 5,000 orders/month with a 10% contact rate handles 500 tickets/month — enough to justify a small team and to generate measurable returns on automation tools. At this scale, automation that reduces cost-per-ticket from $8 to $3 saves $2,500/month per 500 tickets, producing annual savings of $30,000 against a platform investment that is typically $15,000–$25,000/year.
Mid-market brands typically run 3–8% of revenue on support when well-managed. Brands that have not automated tier-1 tickets (WISMO, standard refunds, address changes) remain toward the upper end; brands with AI-assisted or fully autonomous resolution on these ticket types move toward the lower end.
Enterprise brands ($50M+ GMV)
At enterprise scale, the support cost ratio benefits from three overlapping efficiencies: scale (more orders across a fixed cost base), specialization (tier-1 tickets handled by lower-cost agents or automation, complex cases by senior staff), and outsourcing or automation of routine volume. Enterprise support operations targeting best-in-class cost ratios run 2–5% of revenue, achievable through a combination of proactive WISMO suppression, automated returns resolution, and outcome-priced AI agents on tier-1 cases.
What Is the Per-Ticket Cost Behind These Ratios?
The ratio benchmarks above translate to per-ticket economics. At the true cost of an ecommerce support ticket, the blended cost runs:
| Ticket Handling Model | Cost Per Ticket | Annual Cost at 500 Tickets/Month |
|---|---|---|
| Human agent (fully loaded) | $5–$13.50 | $30,000–$81,000 |
| AI deflection (bot — not resolved) | $1.84 (Gartner self-service median) | $11,040 (high escalation rate) |
| AI with end-to-end resolution | $1–$3 per resolved case | $6,000–$18,000 |
The Gartner figure — $1.84 median cost per self-service contact vs. $13.50 per assisted contact — understates the full picture because many self-service interactions that are counted as deflections eventually escalate to assisted contacts. The true self-service resolution cost is lower; the true deflection cost, once escalation is counted, is higher than the $1.84 headline.
End-to-end AI resolution bridges this gap. The cost is typically $1–$3 per resolved case at per-resolution pricing, producing a blended cost structure closer to the Gartner self-service figure while achieving the resolution outcome of the assisted-contact model. That gap — $13.50 assisted vs. $1–$3 per AI-resolved case — is where the support cost ratio improvement comes from.
Why Do SMBs Overspend on Support?
What Causes the SMB Support Cost Gap?
Three structural reasons drive SMB support cost ratios higher than enterprise benchmarks:
1. Fixed cost floors at low order volumes
Support has a minimum viable overhead: a helpdesk subscription ($50–$500/month), at least one responsive agent to handle contacts within the SLA window, and the management time to handle escalations and returns disputes. At 200 orders/month with a 10% contact rate, these fixed costs spread across 20 tickets — a cost per ticket that is 10–20× what the same costs would produce at 2,000 tickets/month. This fixed-cost floor is the primary driver of micro-brand support cost ratios, not operational inefficiency.
2. High contact rates in early-stage operations
New ecommerce brands have above-average contact rates because product descriptions are less accurate, tracking communication is less proactive, and return processes are less clear. A brand at $500K GMV with a 20% contact rate handles 400 tickets/month on 2,000 orders — the same volume a more mature brand at $2M GMV might handle on 10,000 orders with a 4% contact rate. The support cost ratio for the less mature brand is 5× higher despite similar ticket counts, because the ratio is driven by both the cost-per-ticket and the ticket-to-order ratio.
3. The headcount staircase
Support headcount grows in discrete steps — a part-time hire, then a full-time hire, then a second full-time hire. Between the steps, cost-per-ticket falls as volume fills capacity. At each new hire, it jumps. Brands that operate at the "wrong" point in the staircase — where volume requires a new hire but does not yet fully justify the cost — absorb a support cost ratio that is temporarily elevated. This effect is most pronounced for brands crossing 200, 500, and 1,500 tickets/month — the typical inflection points for part-time, full-time, and two-agent configurations.
When Does Support Cost Become a P&L Problem?
Support cost becomes a measurable P&L problem at three thresholds:
-
When support cost exceeds 10% of revenue for two or more consecutive quarters. At this level, support is consuming gross margin that should fund growth or operations. Brands in this zone often discover that marketing ROI calculations undercount support cost as a cost-of-acquisition component, inflating apparent customer LTV.
-
When support headcount grows proportionally with orders — the classic "support doesn't scale" trap. If adding 1,000 monthly orders requires adding a support agent, the brand is operating on a linear cost curve that automation can convert to a step-function curve: add a batch of automation, handle 2–3× more tickets without a hire.
-
When cost-per-ticket rises quarter over quarter — even at flat total cost, a rising cost-per-ticket signals that ticket mix is shifting toward complex cases. The typical cause: WISMO and simple refund automation is working, but the residual tickets are harder. Without a second layer of automation (multi-system case resolution, carrier dispute handling, returns decisioning), the average cost per ticket drifts upward as the easy tickets are deflected away.
How Does AI Automation Change the Support Cost Curve?
What Is the Automation Impact on Support Cost Ratios?
AI automation with genuine end-to-end resolution capability — not deflection chatbots, but agents that take action across Shopify, helpdesk, carrier APIs, and payment processors — changes the cost curve in two distinct ways:
First lever: Reduce cost per ticket on tier-1 volume
WISMO, standard returns, refund requests, address changes, and order modification tickets make up 60–75% of ecommerce support volume. Per WISMO automation benchmarks, proactive notifications reduce WISMO contact rate by 30–50%, and autonomous resolution handles the remaining contacts at $1–$3 per resolved case versus the $5–$8 typical of human-handled WISMO tickets.
At 500 WISMO tickets/month, this conversion — from 500 × $6 = $3,000 to 500 × $2 = $1,000 — saves $2,000/month and compounds as order volume grows. The same agent configuration resolves 2,000 WISMO tickets/month at $4,000 versus the $12,000 a human-agent model would cost.
Second lever: Eliminate the headcount staircase
When automation handles 60–85% of tier-1 tickets, the trigger for a new headcount hire shifts from "250 more tickets/month" to "250 more complex or exception tickets/month." The complex ticket rate is typically 15–25% of total ticket volume — meaning the brand can grow to 3–4× its current order volume before headcount pressure returns. This flattens the support cost curve and converts the headcount staircase into a gradual slope.
What Does the Support Cost Curve Look Like With and Without Automation?
| Monthly Orders | Human-Only Support Cost as % GMV | AI-Automated Support Cost as % GMV |
|---|---|---|
| 500 orders | 12–18% | 6–10% |
| 1,000 orders | 8–12% | 4–7% |
| 2,500 orders | 6–9% | 2.5–5% |
| 5,000 orders | 4–7% | 1.5–3.5% |
| 10,000+ orders | 3–5% | 1–2.5% |
Assumptions: $60 average order value, 10% contact rate (human-only), 4% contact rate (AI-automated, with proactive WISMO notifications suppressing 40% of contacts); $7 blended human ticket cost; $2 AI resolved-case cost on tier-1; 20% complex tickets still handled by humans at $10/ticket each.
The automation impact is most visible in the 1,000–5,000 orders/month range. Below 500 orders/month, the per-case platform cost may outweigh savings unless the brand has a high-contact-rate product category that generates disproportionate ticket volume. Above 5,000 orders/month, automation ROI is typically measurable in weeks, not months.
How to Benchmark and Reduce Your Support Cost Ratio
How Do You Calculate Your Own Support Cost as % of Revenue?
To establish your actual support cost ratio:
- Total support staff cost: Sum all support employee salaries, benefits, and contractor fees for the period.
- Tooling and platform costs: Helpdesk subscription, AI tools, returns management software, shipping claim tools.
- Manager and training overhead: Estimate the proportion of team lead and operations time attributable to the support function.
- Divide by revenue: (Total support cost) ÷ (GMV or net revenue) for the same period.
Most brands find their actual ratio is 20–40% higher than their initial estimate because manager time, training, and tooling are attributed to other cost centers rather than to support. If your calculated ratio is below 3% and you have meaningful ticket volume, check whether all cost components are included.
What Are the Highest-ROI Actions to Reduce Support Cost Ratio?
Ranked by impact-to-effort ratio for brands in the 500–5,000 orders/month range:
1. Proactive WISMO notifications — the single highest-ROI action for brands where WISMO makes up 30–50% of tickets. Suppressing 40% of WISMO contacts at scale is often cheaper to implement than one additional hire and produces a proportional reduction in contact rate. See the WISMO automation guide for implementation specifics.
2. Exchange-first returns routing — converts the most expensive ticket type (returns) into a revenue-recovery event. Per Exchange-First Returns Economics, a 35% exchange acceptance rate on 200 return tickets/month saves the cost of 70 refund resolutions and 70 re-acquisition events on top of the direct ticket cost saving.
3. End-to-end AI resolution on tier-1 tickets — agents that resolve WISMO, standard refunds, and order modification tickets autonomously across the full system stack (Shopify, helpdesk, carrier APIs) convert the highest-volume ticket classes from a per-agent cost to a per-resolved-case cost at 30–60% lower per-ticket spend. CorePiper's SOP-driven AI agents implement this across Shopify, Zendesk, Freshdesk, Salesforce, and Jira without replacing the existing helpdesk infrastructure.
4. Returnless refund decisioning — eliminates reverse logistics cost on low-value returns, reducing the per-return burden at the logistics level while cutting the ticket handling time for returns that previously required physical receipt confirmation. See Returnless Refund Decisioning for the break-even threshold calculation by category.
What Is the ROI Calculation for Support Automation?
For a brand at 1,000 tickets/month with a current blended cost of $7/ticket ($7,000/month total support cost):
| Automation scenario | Cost per ticket | Monthly support cost | Monthly savings |
|---|---|---|---|
| Baseline (human-only) | $7.00 | $7,000 | — |
| AI resolves 65% of tier-1 | $3.20 blended | $3,200 | $3,800/month |
| AI resolves 80% of tier-1 | $2.60 blended | $2,600 | $4,400/month |
At $3,800/month in savings, a platform at $2,000/month cost produces a net saving of $1,800/month — payback in under 30 days. At $4,400/month in savings against a $2,500/month platform, net saving is $1,900/month with similar payback. For brands where support cost is currently 8–12% of revenue, moving to the 3–5% range at comparable volume is achievable in one to two quarters with this automation stack.
Frequently Asked Questions
What is a good support cost ratio for an ecommerce brand?
A good support cost ratio for ecommerce is under 5% of revenue for mid-market and enterprise brands, and under 10% for brands in the $1M–$5M GMV range. Ratios above 10% for sustained periods signal either a high-contact-rate product issue or an automation gap. At 5,000+ orders/month, ratios above 6% typically indicate untapped automation ROI.
Does outsourcing support reduce the support cost ratio?
Outsourcing reduces the variable cost per ticket (outsourced agent rates are typically $3–$7/hour versus $15–$25/hour for in-house agents at US wages) but adds coordination overhead, knowledge transfer cost, and quality variance. For brands with high ticket volumes and routine ticket mix, outsourcing can compress the ratio by 30–40%. For brands with complex, multi-system tickets (freight claims, carrier disputes, cross-platform case management), outsourcing without AI tooling often increases handle time and reduces resolution quality — partially or fully offsetting the labor cost saving.
How does support cost ratio affect ecommerce valuation?
For growth-stage and PE-backed ecommerce brands, support cost as a percentage of revenue is a direct input to EBITDA margin and therefore to valuation multiple. A brand at 8% support cost ratio that reduces to 4% on $10M GMV adds approximately $400,000 to annual EBITDA — at a 4–6× EBITDA multiple, that is $1.6M–$2.4M in enterprise value created from operational improvement alone, without any revenue growth.
At what order volume does AI support automation become ROI-positive?
AI support automation with end-to-end resolution typically becomes ROI-positive at 400–800 tickets/month for brands with a median ticket cost above $5. At per-resolved-case pricing, the break-even is: (current cost per ticket − automation cost per case) × resolved ticket volume ≥ monthly platform cost. Most brands in the 500 ticket/month range break even within 60–90 days of deployment, making payback period a viable evaluation criterion alongside total cost of ownership.
Is support cost tracked as COGS or SG&A?
Most ecommerce operators classify customer support cost as SG&A (selling, general, and administrative expense) rather than COGS. However, for brands where support is a direct cost of delivering the product experience — particularly in DTC and subscription models where support interactions are part of the service contract — there is an argument for partial COGS classification. The choice affects gross margin presentation but not the underlying economics. Regardless of classification, tracking support cost as a percentage of revenue provides the cleanest apples-to-apples benchmark across peer companies.
Mustafa Bayramoglu is co-founder of CorePiper (YC W19). He has spent six years building SOP-driven AI agents for enterprise case operations across logistics, DTC ecommerce, and multi-system support environments.
Reduce Your Support Cost Ratio Without Cutting Resolution Quality
CorePiper's SOP-driven agents resolve tickets end-to-end across Shopify, Zendesk, Freshdesk, Salesforce, and Jira — converting the $13.50 assisted-contact cost into a sub-$3 per-resolved-case model. See how brands move from the SMB support cost curve to the enterprise support cost curve without the headcount.
Reduce Your Support Cost Ratio Without Cutting Resolution Quality
CorePiper's SOP-driven agents resolve tickets end-to-end across Shopify, Zendesk, Freshdesk, Salesforce, and Jira — converting the $13.50 assisted-contact cost into a sub-$3 per-resolved-case model. See how brands move from the SMB support cost curve to the enterprise support cost curve without the headcount.