
The True Cost of Ecommerce Returns in 2026: Full P&L Breakdown
The true cost of an ecommerce return is 25–65% of item revenue — not just the refund. This full P&L breakdown covers reverse logistics, restocking, fraud absorption, and support handling, with benchmarks for apparel, electronics, and general merchandise.
 Mustafa BayramogluAugust 26, 202614 min read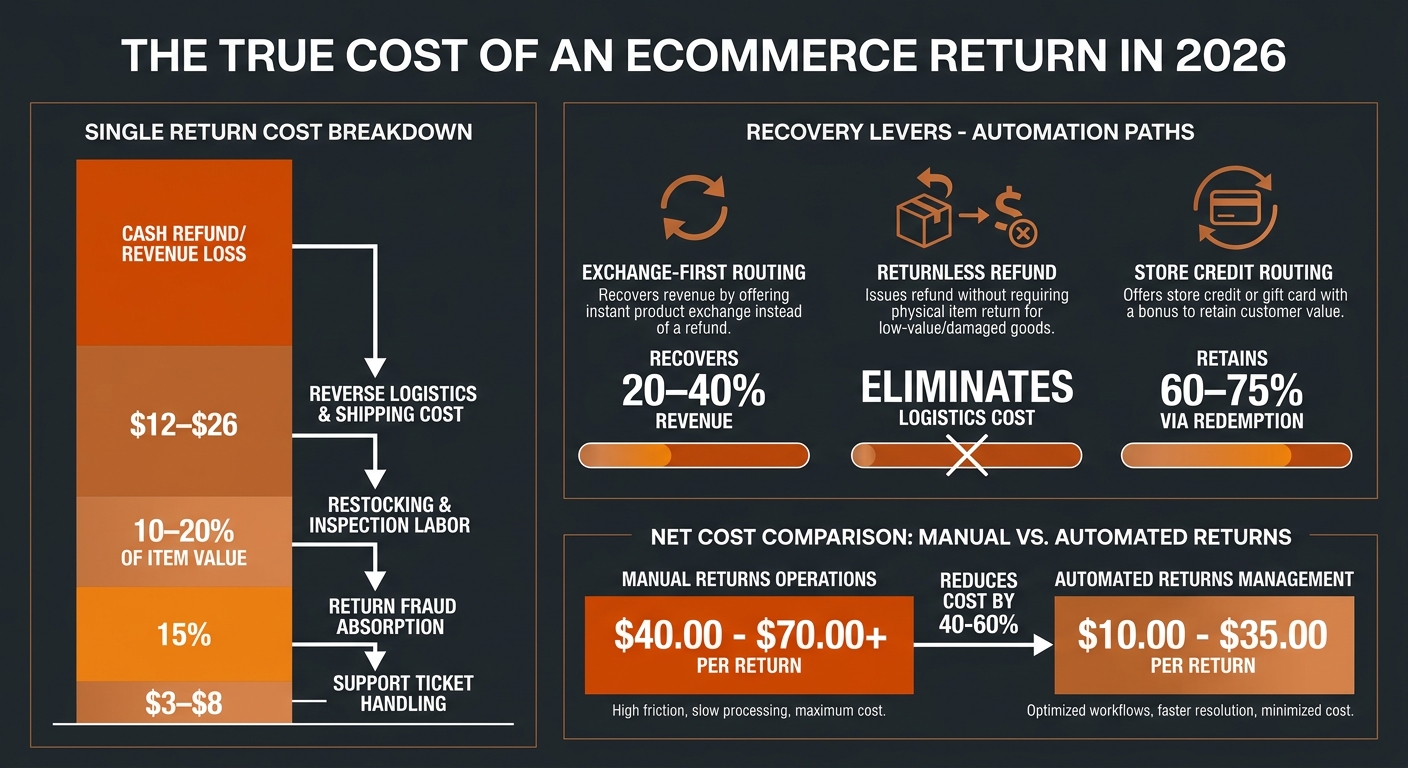
The True Cost of Ecommerce Returns in 2026: Full P&L Breakdown
The true cost of an ecommerce return is not the refund amount. When reverse logistics, restocking labor, fraud absorption, and support ticket handling are added to the cash-out, the full per-return cost reaches 25–65% of item revenue — before accounting for the customer acquisition cost embedded in the original order. At 500 returns per month, that gap between the "refund we issued" and the "cost we absorbed" is often $15,000–$40,000 per month that never appears on a single line item.
TL;DR: True Cost of an Ecommerce Return at a Glance
| Cost Component | Typical Range | P&L Line |
|---|---|---|
| Refund / cash-out | 100% of item revenue | Revenue reduction |
| Reverse logistics (parcel return) | $12.50–$26.50 per return | Logistics / COGS |
| Restocking, inspection, repackaging | 10–20% of item value | COGS / labor |
| Return fraud absorption | 9–15% of return volume | SG&A / write-offs |
| Support ticket handling | $3–$8 per claim | SG&A / support ops |
| Fully loaded cost per return | 25–65% of item revenue | Blended |
The sections below quantify each component, benchmark them by category, and show where automation directly reduces the total.
What Is the True Cost of an Ecommerce Return?
What Does Reverse Logistics Actually Cost?
Reverse logistics — the process of receiving, transporting, inspecting, and routing a returned item — is the largest hidden cost in returns operations for most brands. The surface number is the return shipping label. The full number is higher.
Industry analysis of parcel return economics puts the fully loaded reverse logistics cost at $12.50–$26.50 per return, depending on carrier, zone, package weight, and whether the item can be resold as new. The breakdown:
- Return shipping label: $6–$14 per parcel, depending on carrier contract and weight. Standard UPS/FedEx label for a 2-lb parcel runs approximately $8–$12 at SMB rates.
- Inbound handling: $1.50–$3.00 per unit for receiving, scanning, and staging.
- Inspection and grading: $2–$5 per unit for condition assessment, photos, and routing decision (restock, refurbish, liquidate, dispose).
- Repackaging to resale condition: $1–$4 per unit for apparel refolding/retagging, electronics re-boxing, or specialty item reconditioning.
Items that cannot be restocked as new — common in apparel, cosmetics, and food-adjacent categories — require a markdown of 20–60% on liquidation channels, adding an additional 10–30% of item revenue to the cost column.
What Does Restocking and Inspection Labor Cost?
Beyond the logistics line, every returned item that re-enters inventory requires labor to inspect, restock, and update records. The labor cost is typically estimated at 10–20% of item value, though the actual figure depends on SKU complexity and fulfillment center wage rates.
For a $50 item: restocking and inspection adds $5–$10 in labor cost before the item is available for resale. For items that require repackaging, quality control, or refurbishment, the range extends to 20–30% of item value.
This cost is often absent from returns dashboards because it is absorbed into fulfillment labor budgets rather than attributed per return. The result is a systematic undercount of true returns cost.
How Does Return Fraud Inflate the True Cost?
Return fraud is the component most likely to be underestimated. Per Appriss Retail's 2024 National Retail Federation return fraud report, approximately 9–15% of ecommerce returns involved some form of fraud — including wardrobing (returning worn items), empty-box or wrong-item fraud, and friendly fraud chargebacks. The NRF's October 2025 update with Happy Returns cites 9% as the measured rate; other analyses tracking broader claim patterns put the figure closer to 15% depending on category and brand fraud-prevention maturity.
At a 12% blended fraud rate on $100,000 monthly return volume:
- Fraudulent returns absorbed: $12,000 per month in merchandise value received but not returnable to inventory
- Chargeback fees: $15–$100 per case, depending on your payment processor and chargeback rate tier
- Investigation and review labor: $5–$15 per flagged claim when handled manually
Most of this cost is absorbed as write-offs rather than tracked to the returns operation. For brands processing more than 300 returns per month without automated fraud scoring, this is the single largest untracked cost in the returns P&L.
What Does the Support Ticket Add to the True Cost?
Every return generates at least one support interaction — typically a ticket at submission, sometimes a follow-up on status, and occasionally a dispute if resolution takes longer than expected. Per the benchmarks in The True Cost of a Support Ticket in E-commerce, the blended cost of an e-commerce support ticket runs $3–$8 per resolved claim when agent time, overhead, and repeat-contact rate are included.
For return-related tickets, the cost tends toward the upper end because:
- Return tickets are longer than average (multiple touchpoints: submission, label issuance, receipt confirmation, refund execution)
- Dispute and escalation rates are higher than for order status tickets
- Resolution often requires action across two or more systems (OMS, helpdesk, payment processor)
A brand processing 500 returns per month absorbs $1,500–$4,000 per month in support cost attributable to returns — a line item that typically does not appear in the returns cost model but is borne by the support budget.
How Do Return Rates Vary by Category?
What Are the Average Return Rates for Ecommerce Categories?
Return rates are the multiplier on every per-return cost. A brand with a 25% return rate absorbs 2.5× the per-return cost of a brand at 10% — making category return rate the primary driver of total returns exposure.
Category benchmarks:
| Category | Average Annual Return Rate | Peak Season Rate |
|---|---|---|
| Apparel and footwear | 20–30% | 35–45% |
| Electronics and accessories | 8–15% | 12–20% |
| Furniture and home goods | 5–10% | 8–12% |
| General merchandise | 10–15% | 15–20% |
| Luxury goods | 5–10% | 8–12% |
| Health and beauty | 5–8% | 6–10% |
Apparel is the most exposed category because sizing uncertainty drives high return rates that are structurally resistant to reduction — customers order multiple sizes intentionally ("bracketing"), and the cost of converting the return into an exchange is limited by inventory availability.
Peak season amplifies every category's return rate. Post-Christmas returns typically spike 25–45% above the annual average, with the highest volume occurring in the first two weeks of January. See Ecommerce Returns Peak Season for the full playbook on absorbing the surge.
What Is the Fully Loaded True Cost of an Ecommerce Return?
How Do You Calculate the Total Return Cost Per Item?
The fully loaded cost of an ecommerce return for a representative $60 item in apparel:
| Cost Component | Calculation | Amount |
|---|---|---|
| Refund issued | $60.00 item value | $60.00 |
| Reverse logistics | $10.00 shipping label + $2.50 handling + $3.00 inspection | $15.50 |
| Restocking labor | 15% × $60 | $9.00 |
| Return fraud absorption (12% rate) | 12% × $60 | $7.20 |
| Support ticket handling | 1.2 tickets × $5 blended | $6.00 |
| Total cost of this return | $97.70 | |
| Item resold as returned merchandise (markdown) | −$24.00 (40% recovery on $60 original) | −$24.00 |
| Net cost after resale recovery | $73.70 | |
| As % of original item revenue | ~123% |
This example illustrates why returns in high-rate categories can push total merchandise margin negative: the brand spent $60 acquiring the item (COGS), recovered $60 at sale (revenue), then spent an additional $37.70 absorbing the return before recovering $24 at markdown — netting a loss of $13.70 on what appeared at first glance to be a break-even transaction.
At What Scale Does Returns Become a P&L Crisis?
For brands processing fewer than 100 returns per month, returns costs are manageable as a variable expense. At 500 returns per month, the fully loaded cost for an apparel brand at a 25% return rate becomes significant:
| Monthly Returns Volume | Fully Loaded Cost per Return | Monthly Returns P&L Burden |
|---|---|---|
| 100 returns | $35–$55 | $3,500–$5,500 |
| 500 returns | $35–$55 | $17,500–$27,500 |
| 1,000 returns | $35–$55 | $35,000–$55,000 |
| 2,500 returns | $30–$50 (scale efficiencies) | $75,000–$125,000 |
At 1,000 returns per month, the returns operation costs $35,000–$55,000 per month in direct expense before any consideration of the working capital tied up in in-transit returned inventory. That is a $420,000–$660,000 annual burden — enough to justify dedicated operational investment in returns optimization.
How Does Automation Reduce the True Cost of Ecommerce Returns?
What Are the Three Automation Levers That Reduce Per-Return Cost?
Three automation strategies directly reduce the true cost of returns by attacking different cost components:
1. Exchange-First Routing — Recover Revenue Before Issuing a Refund
Exchange-first routing intercepts return requests before they become refund events and offers the customer an exchange for a different size, color, or comparable item. When accepted, the exchange eliminates the refund (and associated cash-out), converts the return into a second sale, and typically reduces reverse logistics costs if the original item can be shipped to the replacement-order recipient rather than returned to the warehouse.
Per Exchange-First Returns Economics, exchange acceptance rates run 30–45% for apparel and 15–25% for general merchandise when the offer is made at submission rather than after refund processing. Brands that implement exchange-first routing as the default path recover 20–40% of return revenue that would otherwise exit the business as a cash refund.
2. Returnless Refund Decisioning — Eliminate Reverse Logistics on Low-Value Items
For items where the reverse logistics cost exceeds the item's resale value, requiring the physical return creates a net loss that is larger than issuing a refund without requiring the return. Returnless Refund Decisioning documents the break-even calculation:
- Apparel break-even threshold: $20–$35 item value
- Electronics break-even threshold: $15–$25
- Freight-shipped items break-even threshold: $50–$100+
Items below the break-even threshold are cheaper to write off and refund than to ship back, inspect, restock, and mark down. Automating this gate at claim submission eliminates $12.50–$26.50 in reverse logistics cost per qualifying return — the second-largest cost component in the true cost breakdown.
3. Store Credit Routing — Retain Revenue Through Repeat Purchase
Store Credit vs. Cash Refund documents the third automation lever: routing eligible returns to a store credit offer rather than a cash refund keeps the refund value inside the business and creates a second purchase opportunity.
At a 50% store credit acceptance rate with a 65% repeat purchase rate on credit, a brand processing $100,000 in monthly return volume retains approximately $32,500 that would otherwise leave as cash refunds. The store credit incentive cost (typically 5–10% bonus credit) is $1,625–$3,250 per month against $32,500 in retained revenue — a return on incentive spend exceeding 10:1.
What Is the Combined Impact of All Three Automation Levers?
Applied together at 500 returns per month on a $60 average item value (representing $30,000 in return volume):
| Lever | Assumption | Revenue or Cost Impact |
|---|---|---|
| Exchange-first routing | 35% acceptance rate on 500 returns | +$10,500 revenue retained (175 exchanges × $60) |
| Returnless refund (items under $25) | 20% of returns qualify | −$3,125 reverse logistics eliminated (100 returns × $15.50 average) |
| Store credit routing | 45% acceptance on remaining 225 returns | +$4,556 retained via redemption (101 credits × $45 × 65% redemption) |
| Combined impact | +$18,181 per month |
Against a baseline returns burden of $17,500–$27,500 per month, that is a 66–104% reduction in net returns cost — effectively converting the returns operation from a margin drain into a break-even or margin-positive function.
How Do You Calculate Your True Cost of Returns?
Step-by-Step Returns Cost Calculation
Use this five-step formula to establish your true per-return cost:
- Identify your monthly return volume (units returned, not return requests)
- Calculate average reverse logistics cost = (average return label cost) + (inbound handling cost per unit) + (inspection cost per unit)
- Calculate restocking and labor cost = 15% × average item value (adjust up for high-complexity items)
- Estimate fraud absorption = (fraud rate as decimal) × (average item value)
- Add support ticket cost = (average tickets per return) × (average ticket cost per your support economics baseline)
True cost per return = Sum of steps 2–5 (step 1 scales the total to monthly burden).
If you have not previously modeled this, start with the industry average of $35–$55 per return for apparel and $20–$35 per return for general merchandise, then refine with your actual logistics invoices and labor costs.
Frequently Asked Questions
What is a good return rate for ecommerce?
A return rate below 10% is considered strong for general merchandise ecommerce. Apparel and footwear brands at 20–25% are in line with category norms. Return rates above 30% for non-apparel categories typically indicate sizing/description accuracy issues or product quality problems that content and product page improvements can address.
How much do ecommerce returns cost the industry overall?
Ecommerce returns represented approximately $890 billion in total US retail returned merchandise in 2024, per NRF. With processing and absorption costs adding 40–60% to the merchandise value, total industry cost of returns — including logistics, labor, fraud, and write-downs — likely exceeds $1.2 trillion annually. This makes returns processing one of the largest unoptimized cost centers in retail operations.
Can you stop customers from making returns to reduce costs?
Restrictive return policies reduce return volume but increase cart abandonment and reduce first-time purchase conversion. Studies consistently show that free, easy return policies increase conversion rates by 15–30% and repeat purchase rates by 20–35%. The better lever is not to reduce return eligibility but to intercept returns with exchange and store credit offers that retain revenue without requiring the customer to accept a worse outcome.
How do I reduce return fraud without punishing real customers?
Risk-based fraud scoring — checking account age, return frequency, order value, and item category against policy thresholds — identifies the 9–15% of fraudulent returns without adding friction for legitimate customers. See Prevent Return Fraud in Ecommerce for the four-gate decision model. Automated scoring at submission flags high-risk claims for review while routing low-risk claims to instant resolution — protecting margin while maintaining the fast-return experience that drives conversion.
What is the ROI of returns automation?
At 500 returns per month, the three automation levers described above (exchange-first, returnless refund, store credit routing) typically generate $15,000–$20,000 per month in combined cost savings and revenue retention — against a platform cost that is typically a fraction of that figure on a per-resolved-case model. Payback periods under 60 days are common for brands in the 300–1,000 returns per month range.
Mustafa Bayramoglu is co-founder of CorePiper (YC W19). He has spent six years building SOP-driven AI agents for enterprise case operations across logistics, DTC ecommerce, and multi-system support environments.
Automate the Returns Decisions That Reduce Your True Cost Per Return
CorePiper's SOP-driven agents execute exchange-first routing, returnless refund decisioning, and store-credit offers at the ticket level — automatically, at volume. See how brands reduce their true cost per return by 30–45% without increasing headcount.
Automate the Returns Decisions That Reduce Your True Cost Per Return
CorePiper's SOP-driven agents execute exchange-first routing, returnless refund decisioning, and store-credit offers at the ticket level — automatically, at volume. See how brands reduce their true cost per return by 30–45% without increasing headcount.